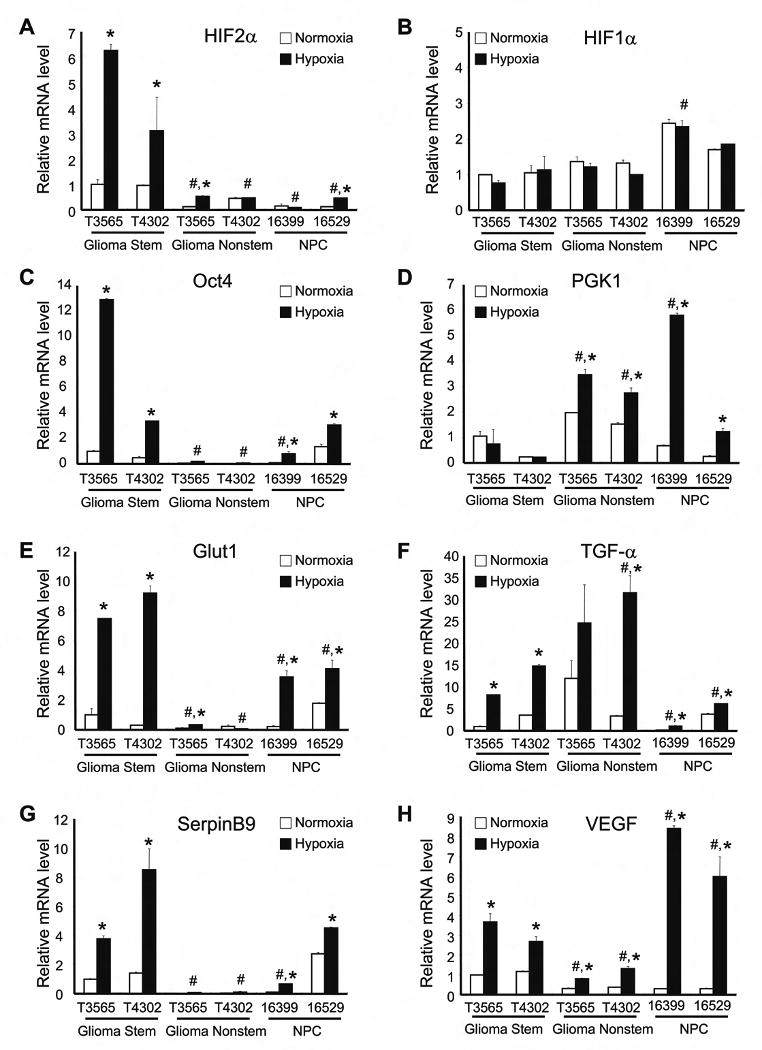
Figure 2. Glioma Stem Cells and Normal Neural Progenitors Differentially Expressed Hypoxia Response Genes.

Cells from T3565 and T4302 glioblastoma samples and two different normal neural progenitor cell preparations were cultured in normoxia (20% oxygen) or hypoxia (1% oxygen) for 24 hr. RT-PCR analysis was performed with primers specific for HIF2α (A), HIF1α (B), Oct4 (C), PGK1 (D), Glut1 (E), TGF-α (F), SerpinB9 (G), and VEGF (H). Data were normalized to β-actin levels. *, P < 0.01 with ANOVA comparison of hypoxia treated cells to identically prepared normoxia controls. #, P < 0.01 with ANOVA comparison of indicated hypoxia treated cells to both hypoxia treated GSCs.
