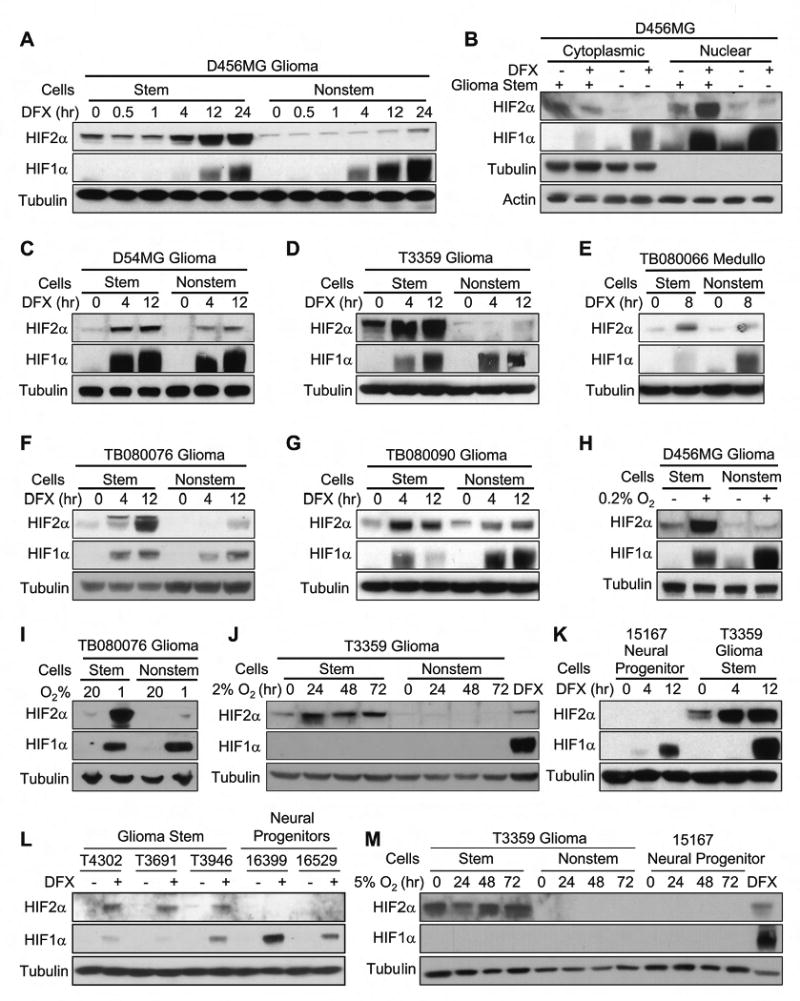
Figure 3. Hypoxia Potently Induced HIF2α Protein Expression in Glioma Stem Cells.

(A-G) Glioblastoma stem and nonstem cells isolated from multiple samples were treated with DFX to mimic hypoxia for the indicated times. Nuclear and cytoplasmic fractions (B) or total cell lysate (A, C, E-G) were analyzed. (H) Cells isolated from D456MG were cultured under 20% or 0.2% oxygen for 24 hr and analyzed by immunoblotting. (I) Cells isolated from TB080076 were cultured under normoxia (20% oxygen) or hypoxia (1% oxygen) for 24 hr and analyzed by immunoblotting. (J) Cells isolated from T3359 were cultured under more modest hypoxia (2% oxygen) and total cell lysates were analyzed. (K) T3359 GSCs and CD133+ normal neural progenitors were treated with 100 μM DFX and total cell lysates were analyzed. (L) GSCs (T4302, T3691, and T3946) and the normal human neural progenitors (16399 and 16529) were treated with DFX and analyzed by immunoblotting. (M) Higher HIF2α protein expression is maintained with a relatively physiological level of oxygen in GSCs. Cells were cultured under physiological level of oxygen (5% oxygen) for the indicated times and total cell lysates collected. In (J) and (M), and DFX treated samples were used as a positive control.
