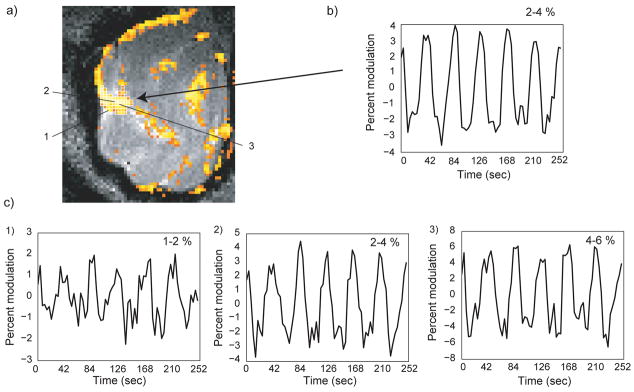
Figure 10.
Visual field mapping in isotropic 0.9 mm resolution. (a) The thresholded coherence map is overlaid onto a coronal T2 anatomical image. (b) The average signal intensity in a randomly selected ROI shows robust activation. (c) To further demonstrate the high-resolution nature of the data, three single voxel signal intensities were plotted. The voxel locations are marked in (a). For voxel number 2, the voxel immediately posterior to the marked voxel was plotted. The signal shows robust activations with highly distinct activations levels.

