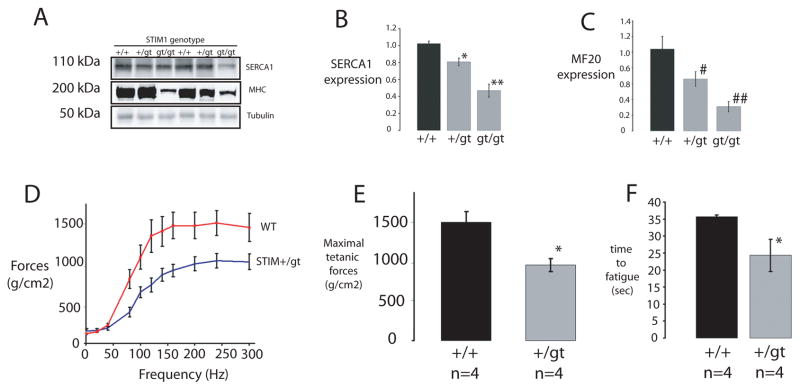
Figure 6. Muscle gene expression and functional analysis of mutant STIM1 mice.
A–C) Muscle protein lysates taken from neonatal mice (STIM1gt/gt, STIM1+/gt versus STIM1+/+) displayed a reduction in SERCA1 (top panel) and Myosin Heavy Chain (middle panel) in mutant STIM1 mice as assessed by immunoblotting with specific antibodies for SERCA1 and MHC (MF20). Quantification using densitometry is provided for studies of three mice for each genotype for SERCA1 (B) and MHC (C). Complete scans of these gels can be found in supplemental information (supplemental Fig 6). D) Contractile force measurements after tetanic stimulation of EDL muscles taken from STIM1+/gt (n=4) and STIM1+/+ mice (n=4). E) Bar graphs represents maximal forces (mean ± SE) following tetanic stimulation for STIM1+/gt and STIM1+/+. F) Bar graph of time to fatigue after repetitive stimulation for muscles taken from STIM1+/gt and STIM1+/+ mice. Time to fatigue was measured using a protocol of one 100Hz stimulation per sec, for a duration of 200ms. Values (mean ± SE) represent the time required for a decay in force generation to 50% maximal force, following stimulation of 4 muscles from each genotype.

