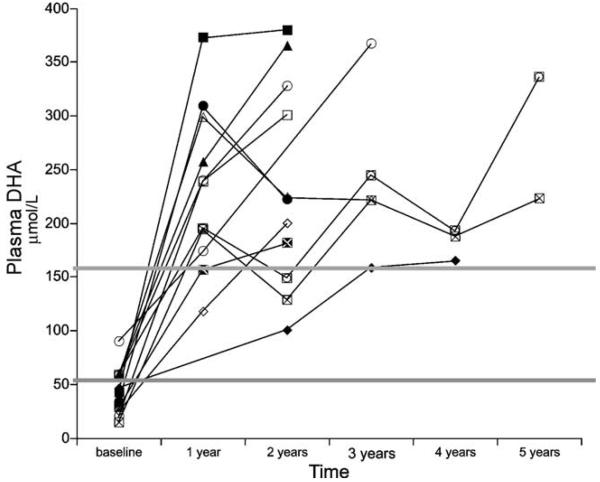
Fig. 2.
Plasma DHA concentrations (μmol/L) in 12 children with LCHAD or TFP deficiency. DHA levels were measured prior to supplementation (baseline) and again annually following the initiation of supplemental DHA (65–130 mg/day). Subjects were followed for 2–5 years. The two gray lines indicate the normal range of DHA concentrations. Plasma DHA significantly increased with time (p=0.007), with levels significantly higher in both years 1 and 2 than at baseline (p=0.003).

