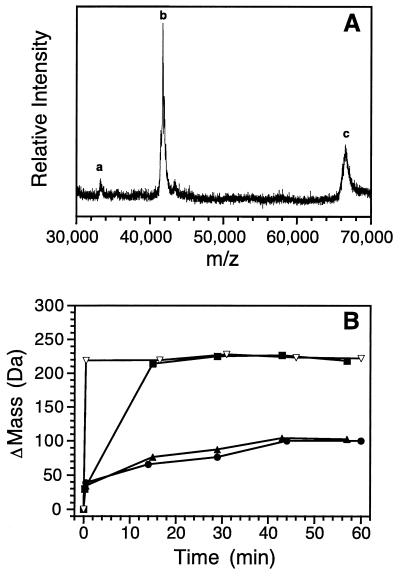
Figure 2.
Hydrogen exchange of MBP detected by MALDI. (A) The MALDI-TOF mass spectrum of a nonexchanged (all protonated) sample. Peak b is the signal from the singly charged molecular ion of MBP, peaks c and a are the signals from the singly and doubly charged molecular ions of BSA, which is added as an internal mass reference. (B) The change in mass (ΔMass) of MBP as a function of exchange time in the presence of different GdmCl concentrations: ●, 0 M; ▴, 1 M; ■, 2 M; and ▿, 6 M.

