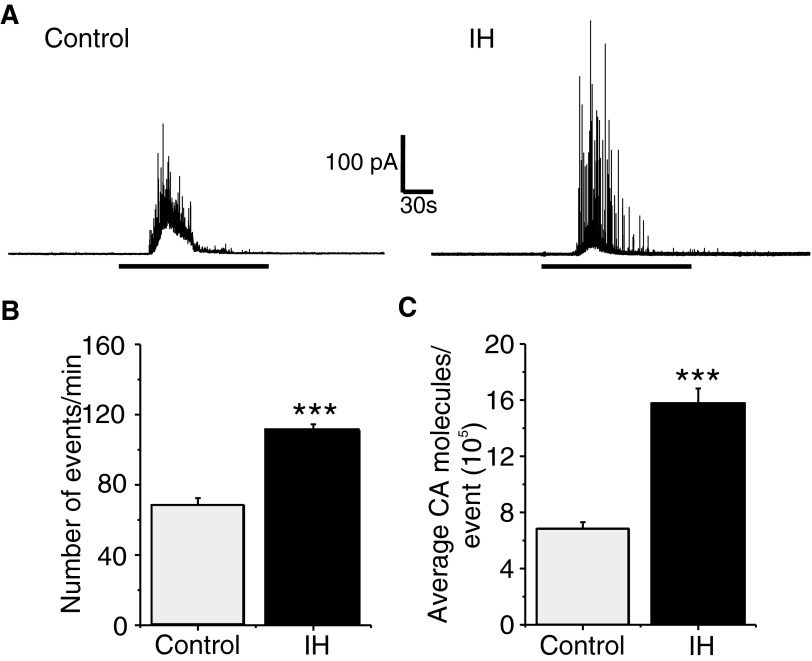
FIG. 2.
Effects of IH on K+-evoked CA secretion from neonatal chromaffin cells. A: examples of K+-evoked CA secretion from chromaffin cell derived from P5 rats reared under normoxia (Control) or IH. The horizontal black bars represent the duration of K+ (40 mM KCl) challenge. B and C: average data of the effects of K+. B: the number of secretory events/min. C: average CA molecules released/event. Data shown are means ± SE. Control = 16; IH = 20 cells obtained from 3 different litters in each group. ***P < 0.0001.

