
FIG. 8.
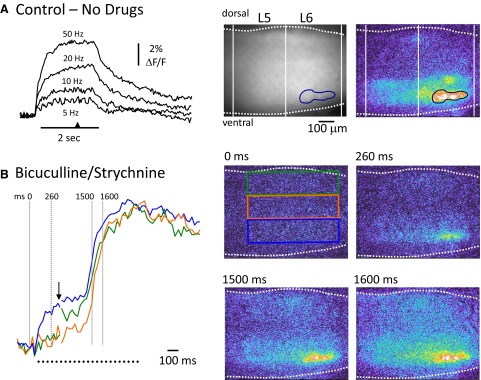
Comparison of the location of antidromically activated motoneurons and ventrally derived optical signals at the onset of a burst triggered by ventral root stimulation. A: antidromic stimulation of motoneurons in the absence of any drugs. Left: the fluorescence transients generated from motoneurons (over the area indicated by the blue region of interest shown in the upper 2 video-micrographs to the right) in response to antidromic stimulation of the right L5 and L6 ventral roots at several frequencies (indicated above traces). The 1st micrograph in A, shows the right L5–L6 area of the electroporated cord viewed from the lateral side. Rightmost: a difference image (8 frame average) of the fluorescence change in response to 50-Hz stimulation taken at the time indicated by the arrowhead on the time calibration bar in A. B: a train of stimuli (100 pulses at 50 Hz) applied to the right L5 and L6 ventral roots (2 s stimulation) in the presence of bicuculline (40 μM) and strychnine (4 μM) initially antidromically activated motoneurons and then triggered a burst. Left: the normalized fluorescence transients recorded from the 3 rectangular regions shown in the videomicrograph at 0 ms. Note that the traces are interrupted at the arrow to show the timing of the activity during the burst in more detail. After the initial antidromic response, a burst is triggered with activity in the ventral region (blue rectangle) leading the activity in the intermediate and dorsal regions. The timing of the last frame in each of the videomicrograph 4 frame averages is shown in milliseconds above the images and over the dotted lines on the fluorescence transients. Each difference image has been subtracted from the prestimulus control and median filtered.