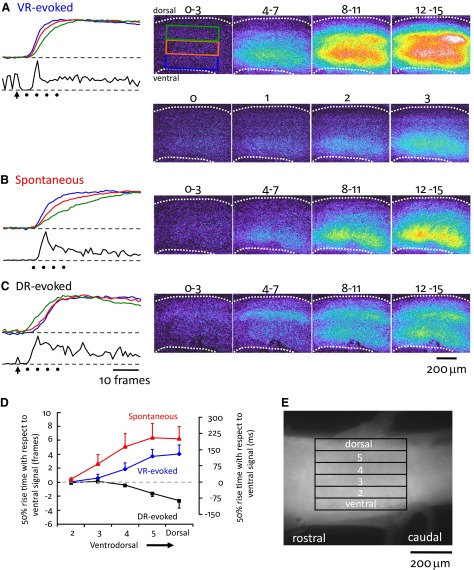
FIG. 9.
Visualization of the spread of optical activity during evoked and spontaneous bursts viewed through the lateral aspect of the cord. A—C: imaging of an electroporated cord during VR-evoked (A), spontaneous (B), and DR-evoked (C) bursting in the presence of bicuculline (40 μM) and strychnine (4 μM). Each image is a median filtered, 4 frame average of the difference image obtained by subtracting the active frames from a preburst average. The time over the images indicates the frames used in the average. The panels to the left of each series of video-micrographs show the optical signals normalized to the peak activity from the ventral (blue), medial (orange), and dorsal (green) areas of the cord (T13–L1 area, left side) over a 55-frame period (30-Hz acquisition) aligned with the VR activity (black traces under optical signals; left L6 ventral root in B and C, and the left L3 in A). The time of the last stimulus in the ventral root train applied to the left T13 ventral root (5 pulses, 20 Hz, 55 μA) is shown by the arrow beneath the electrical trace. The arrow in C indicates the time of a single stimulus applied to the left T13 and L1 dorsal roots (30 μA). The dots under the electrical traces indicate the timing of the last frame of the 4 frame average for each of the 4 sequential video-micrograph averages shown on the right. The frames shown below the images in A and marked 0–3 show individual, sequential frames at the onset of the earliest optical activity in response to a ventral root train of stimuli. Each frame has been averaged from video sequences obtained in 4 different ventral-root evoked bursts and shows the ventral origin of the optical activity. D: graph summarizing the timing (in frames and in ms) of the fluorescent transients recorded from the regions of interest shown in E. The 50% rise time of the optical transient is expressed with respect to the 50% rise time of the most ventral transient. Data are averaged from 5 experiments and expressed as means ± SE.

