
FIG. 1.
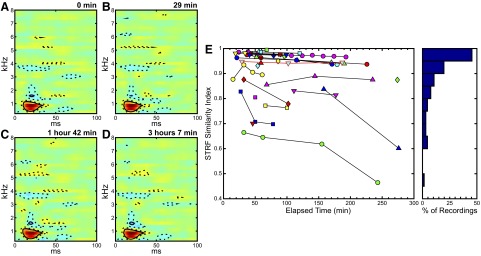
The majority of field L spectrotemporal receptive fields (STRFs) show high similarity across time as measured by the STRF similarity index (SI). A–D: STRF plots obtained from a particular neural recording site; time stamps at the top right corner of each STRF plot indicate the time elapsed after the start of the 1st recording block obtained at that same site. Warmer colors indicate excitatory regions and cooler colors inhibitory regions. E: plot of the STRF SI performed on all sites where multiple recordings were performed, plotted against the time elapsed after the start of the 1st recording block obtained at each site. Values of the SI for the site shown in A–D are outlined in red. To the right, a histogram shows the data in bins of size 0.05.