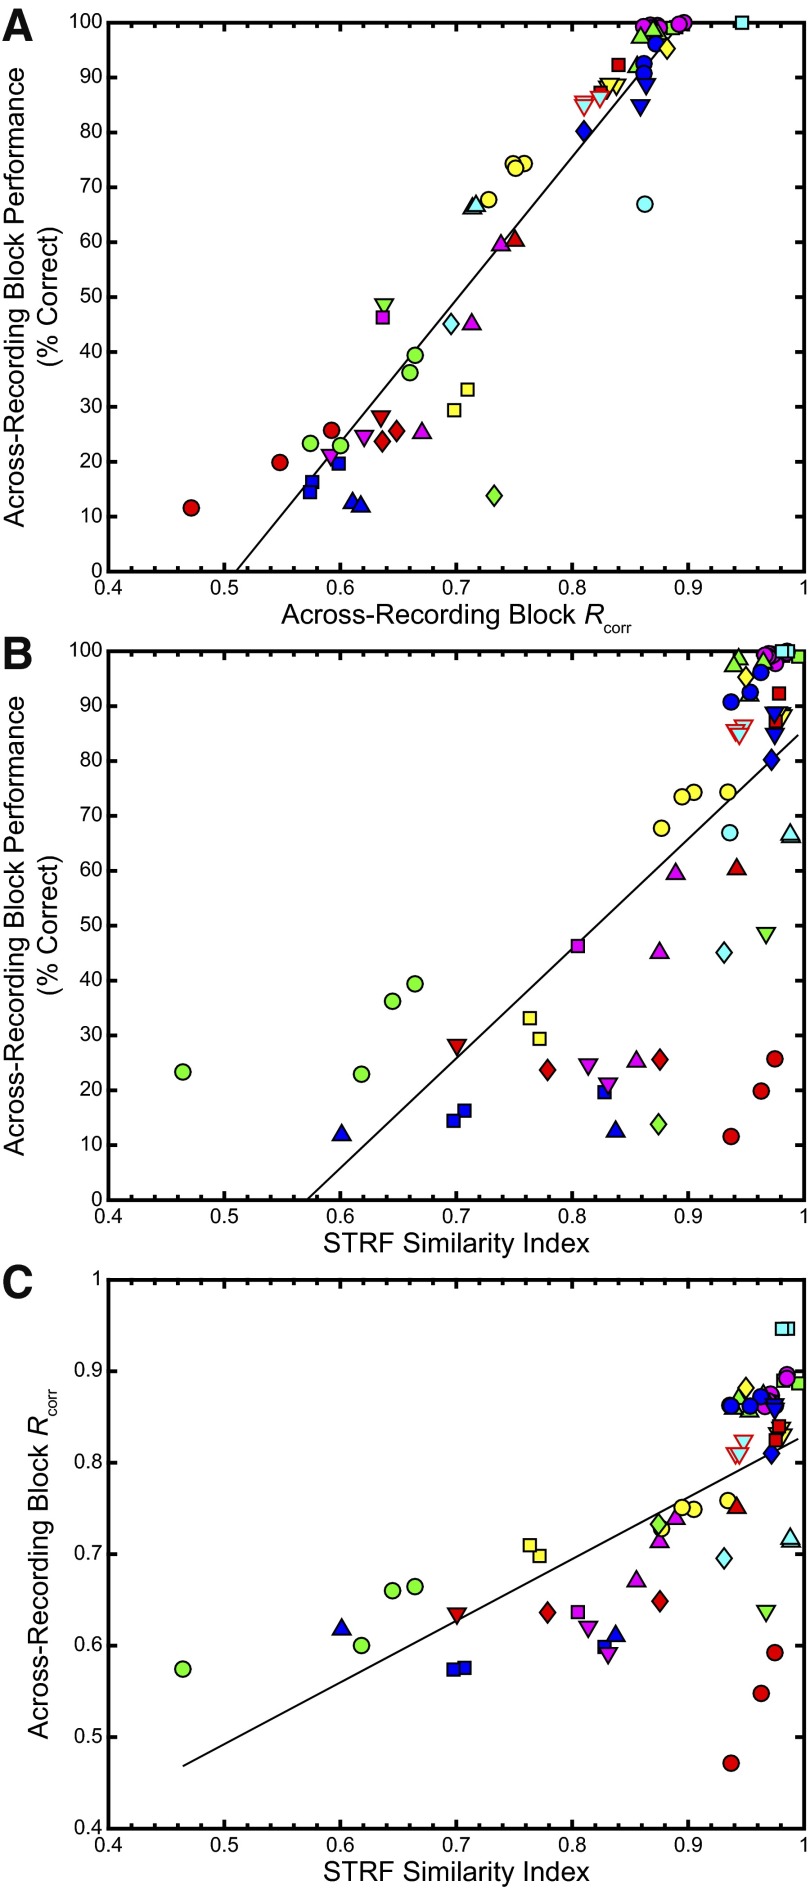
FIG. 4.
Rcorr and performance-based similarity are more correlated to each other than either is to the STRF SI. A: plot of across-recording block discrimination performance vs. across-recording block Rcorr data. A best-fit line is plotted in black; the correlation coefficient between the 2 measures was 0.95 (P < 0.001). B: plot of across-recording block discrimination performance from Fig. 3 vs. the STRF SI. The correlation coefficient was 0.69 (P < 0.001). C: plot comparing across-recording block Rcorr data from Fig. 2E to the STRF SI from Fig. 1. The correlation coefficient was 0.66 (P < 0.001). The data from the example site in Figs. 1 and 2 are outlined in red.

