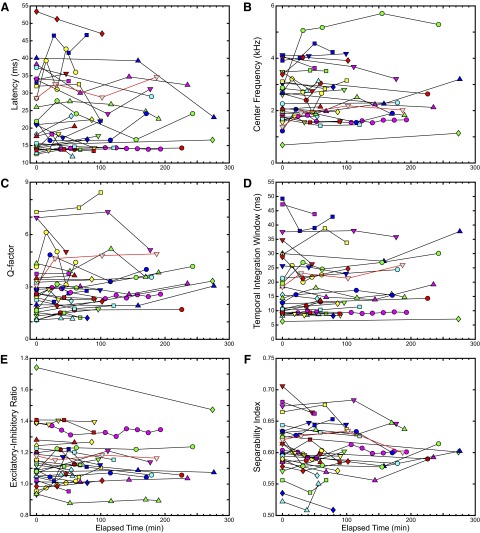
FIG. 5.
Summary of STRF parameters over time. Each plot shows the changes in the STRF parameters described previously, where multiple recordings are made from each site, plotted against the elapsed time since the first recording at the same site. A: latency. B: center frequency (CF). C: quality factor (Q). D: temporal integration window (TiW). E: excitatory–inhibitory ratio (EIR). F: separability index (SI). The data outlined in red correspond to the site featured in previous figures.

