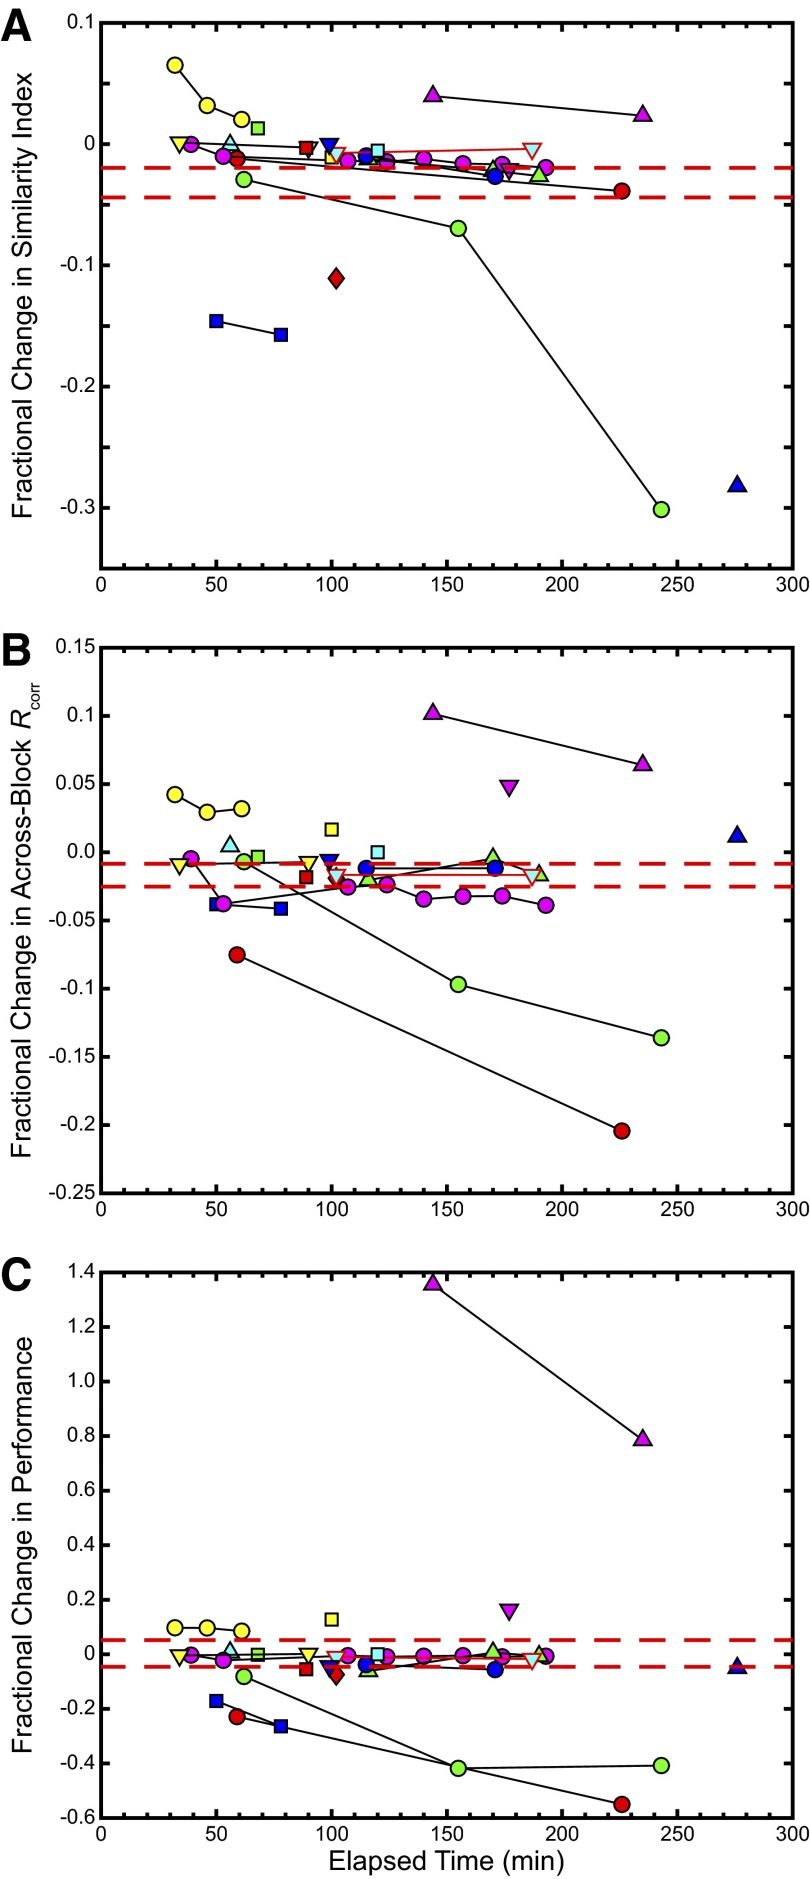
FIG. 6.
Similarity measures show low fractional change over time. Each set of connected symbols shows the fractional change in (A) similarity index values, (B) across recording block Rcorr values, and (C) performance-based similarity measure values, relative to the 1st value against the elapsed time since the 1st neural recording at a particular neural site. The red dashed lines indicate the SE. As before, the example site is outlined in red.

