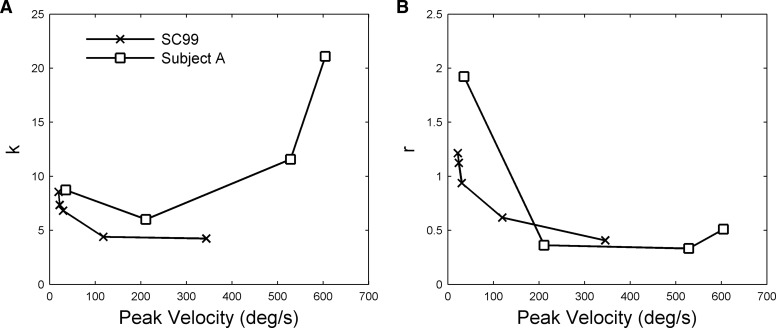
FIG. 10.
Comparison of nonlinearities for firing-rate and stimulation data. The firing rate curves (SC99) are taken from Fig. 14 of Sylvestre and Cullen (1999), who used a 2nd-order plant model (Eq. 5) to derive position k and velocity r coefficients. These varied with eye-movement peak velocity as shown. The same model was used to model stimulation data from subject A at 4 frequencies (100, 200, 400, and 600 Hz as shown in Fig. 6B, with the 100- and 200-Hz responses smoothed), and the derived frequencies also plotted against eye-movement peak velocity.

