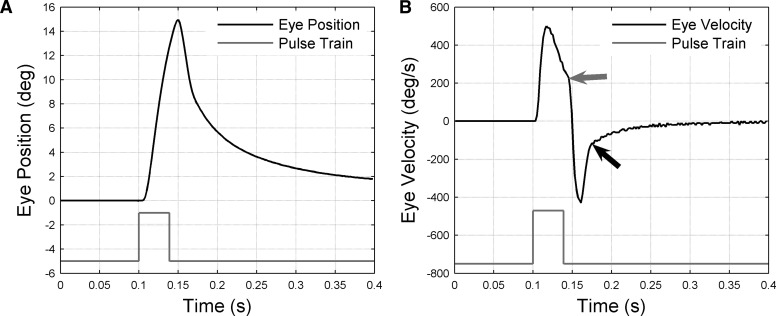
FIG. 2.
Example of eye movement produced by abducens microstimulation. A: change in eye position (black trace) resulting from 39-ms train of pulses delivered at 408 Hz (gray trace: pulse height represents stimulation frequency) delivered to monkey A when eye was in the primary position. Eye position sampled at 500 Hz. Positive eye positions correspond to abduction. B: change in eye velocity (black trace) corresponding to position change in A. Velocity derived from position trace by numerical differentiation. Discontinuities in velocity trace marked by arrows: the gray arrow indicates the point at which about 6 ms after the end of stimulation the abduction velocity starts to decrease rapidly; the black arrow indicates the point at which about 36 ms after the end of stimulation the return velocity starts to decrease slowly.

