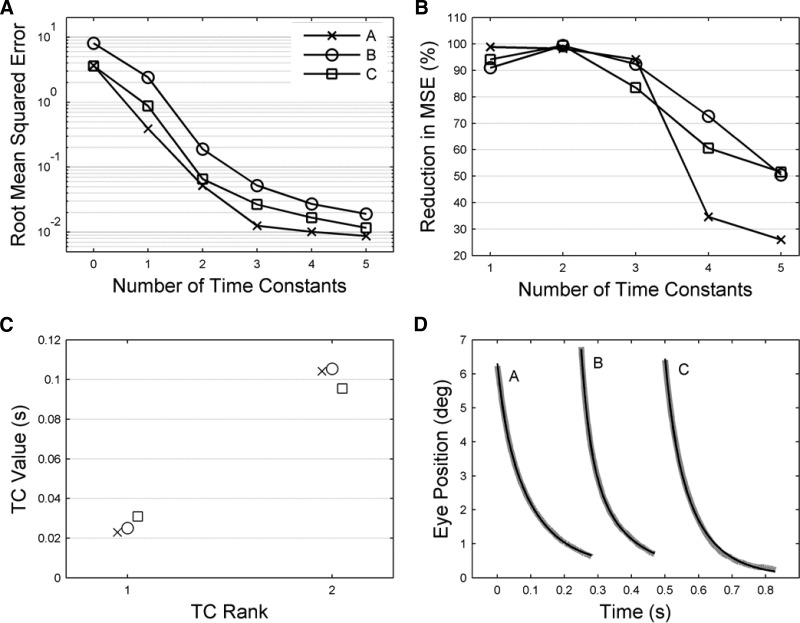
FIG. 4.
Time constant (TC) values for unstimulated plant, estimated by fitting exponential terms to return curves from 40 ms after end of stimulation. A: fitting errors plotted as a function of the number of TCs used for fitting. Fitting errors were calculated as the root mean squared errors over all traces for a given animal (methods). The value shown for zero-fitted TCs corresponds to the root mean squared values of the original data sets before fitting. The y-axis uses a logarithmic scale. B: the successive reduction in fitting error, expressed as a percentage, produced by fitting each additional TC. The x-axis starts at one, corresponding to the reduction in error of the original data sets produced by fitting a single TC. C: the values for the 2 shortest TCs, when 3 TCs were fitted. Error bars showing 95% confidence limits derived by the bootstrap method are too small to be seen at this scale. Values for the TCs for each animal are A = 23, 104 ms; B = 25, 105 ms; C = 31, 96 ms. D: examples of typical fits for each animal black lines model, gray lines data. The starting time for the traces has been advanced 250 ms for B and 500 ms for C. The VAF (variance accounted for; methods) values for each animal were A, 1.0000; B, 0.9999; C, 0.9999.

