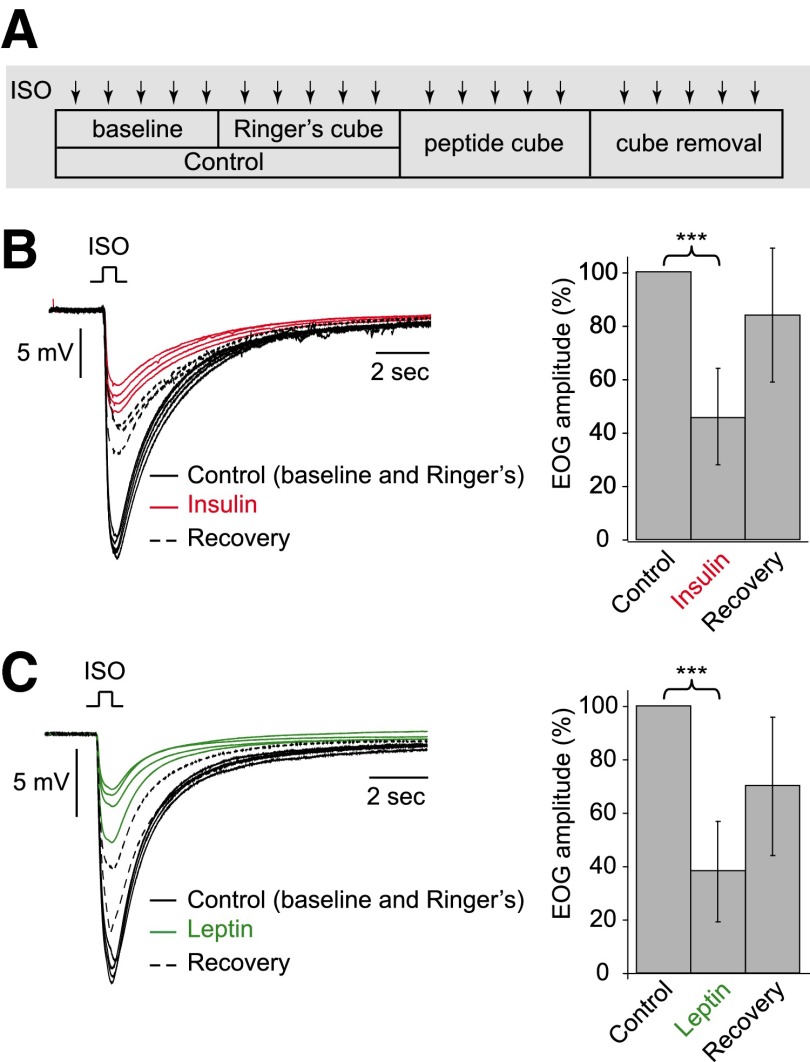
FIG. 5.
Insulin and leptin decrease odorant-induced electroolfactogram (EOG) signals. EOG signals were recorded from the surface of olfactory turbinates in response to isoamyl acetate puffs (ISO, SV/80, 0.5 s). A: during each experiment, 5 ISO stimulations were delivered in each condition: without any cube, with Ringer-soaked cube, with peptide (insulin or leptin)-soaked cube, and after cube removal. B: in 1 preparation, insulin (red lines, 4 traces being shown) reduced the EOG signals (control recordings in black solid lines, 2 traces from each control condition being shown) with partial recovery (black dotted lines, 3 traces being shown). The graph on the right summarizes the normalized EOG signals from 13 preparations. C: in 1 preparation, leptin (green lines) reduced the EOG signals (control recordings in black solid lines) with partial recovery (black dotted lines). Right: graph summarizes the normalized EOG signals from 14 preparations.

