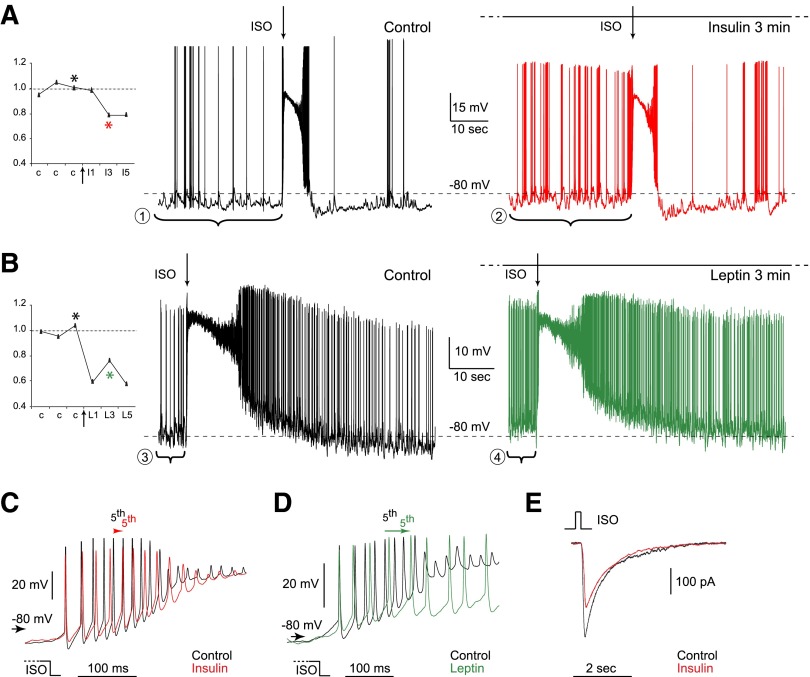
FIG. 6.
Insulin and leptin mainly decrease odorant responses of individual OSNs. All recordings were obtained in perforated patch-clamp configuration. ISO stimulations (250 ms, 100 μM) were interspaced by 2 min A and B: continuous recordings of 2 single OSNs were obtained under current-clamp mode. As depicted on the protocol graphs (left), 3 ISO stimulations were applied in the control condition (c) and during insulin or leptin perfusion, starting at the arrow. For each response, the firing frequency measured within the initial burst is normalized to the averaged frequency obtained from the 3 controls. Black asterisk marks the control response represented by the black trace on the right. Red and green asterisks mark the responses under insulin (red trace) and leptin (green trace) perfusion, respectively. After 3 min of insulin perfusion (A), the spontaneous activity measured 1 min before ISO stimulation increased from 1.0 Hz (bracket 1) to 4.9 Hz (bracket 2). After 3 min of leptin perfusion (B), the spontaneous activity increased from 3.5 Hz (bracket 3) to 8.1 Hz (bracket 4). C and D: ISO-induced responses shown in A and B are superimposed and enlarged to show the initial bursts in C and D, respectively. Insulin decreased the mean instantaneous frequency from 60.4 to 47.7 Hz (C) and leptin from 41.6 to 26.3 Hz (D). The arrows indicate the time shift of the 5th action potentials under control and peptide perfusion. E: under voltage-clamp, insulin perfusion decreased the transduction currents evoked by ISO (250 ms, 100 μM) from 393 pA (black trace) to 263 pA (red trace) in a single OSN. The membrane potential was held at −80 mV.

