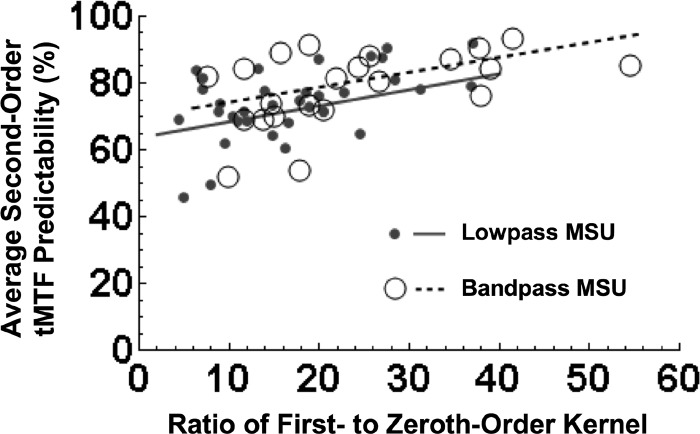
FIG. 5.
Scatter plot of the SNR of the 1st-order response (taken as the ratio of peak to mean excitation) and the 2nd-order predictability of the tMTF. •, low-pass units; ○, band-pass units. Significant correlations between response SNR and predictability were observed for both low-pass (—; r2 = 0.30; P < 10-3) and band-pass units (- - -; r2 = 0.24; P = 0.02).

