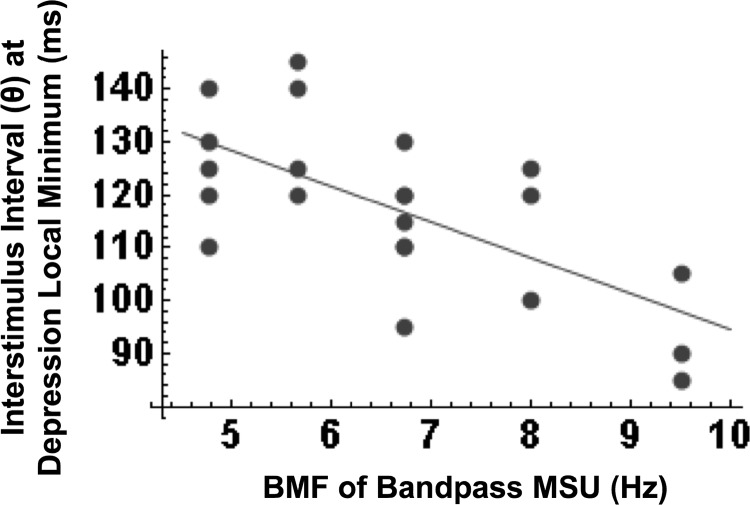
FIG. 6.
Scatter plot of the BMF and the interstimulus lag at which the 2nd-order kernel of a band-pass MSU shows a local minimum in the strength of depression. Data from 20 of the 22 MSUs that exhibited a clear local minimum is included. The correlation between the BMF and the time lag at the local minimum in depression is highly significant (r2 = 0.45; P < 0.001; regression line drawn on plot).

