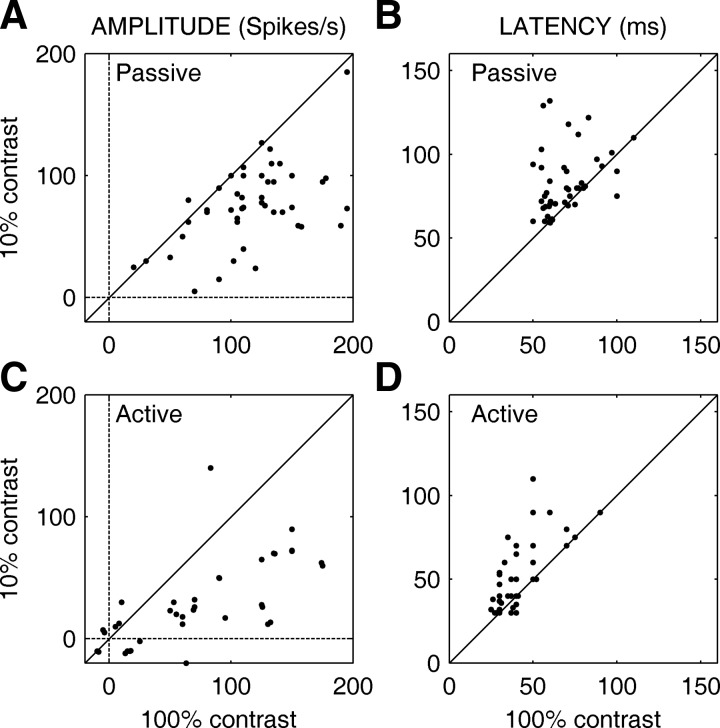
FIG. 3.
Effect of contrast on saccadic suppression in MSTd neurons. A: plot of mean response amplitudes (in spikes/s) generated by passive motion of a stimulus of 100% contrast (abscissa) against responses generated by passive motion of a stimulus of 10% contrast (ordinate). B: plot of the latencies (in milliseconds) of the passive responses shown in A. Note that latencies are longer for the lower-contrast stimulus. C: plot of mean response amplitudes generated by saccades over a background of 100% contrast (abscissa) against responses generated by saccades over a background of 10% contrast (ordinate). D: plot of the latencies (in milliseconds) of the active responses shown in C and, once again, latencies are longer for the lower contrasts. Diagonal lines show the lines of equality.

