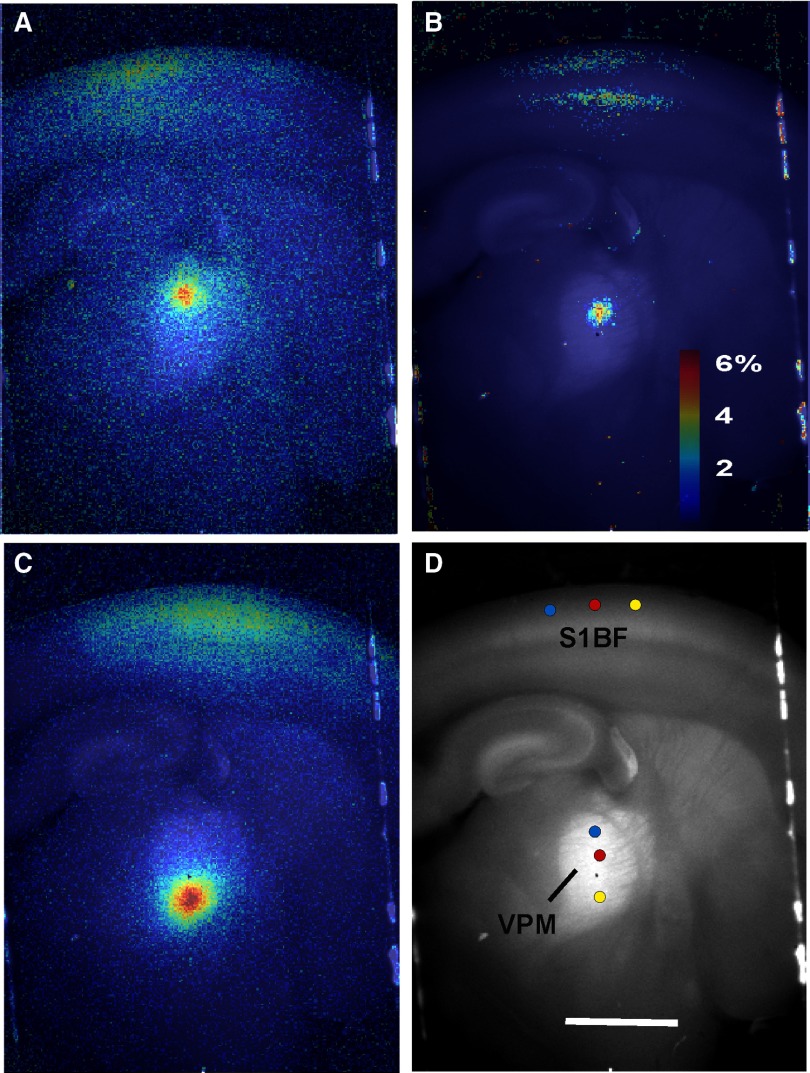
FIG. 10.
Mapping of projections from VPM to S1BF using laser uncaging of glutamate and FA. A–C: Δf/f overlay images illustrating the sequential movement of the laser stimulation site to progressively more ventral portions of VPM. D: composite image of the stimulation sites and the centroid of the response sites from A (blue), B (red), and C (yellow). Stimulus parameters: 5 pulses, duration = 10 ms, interpulse interval = 40 ms, pulse amplitude = 8 mW. All scale bars = 1 mm.

