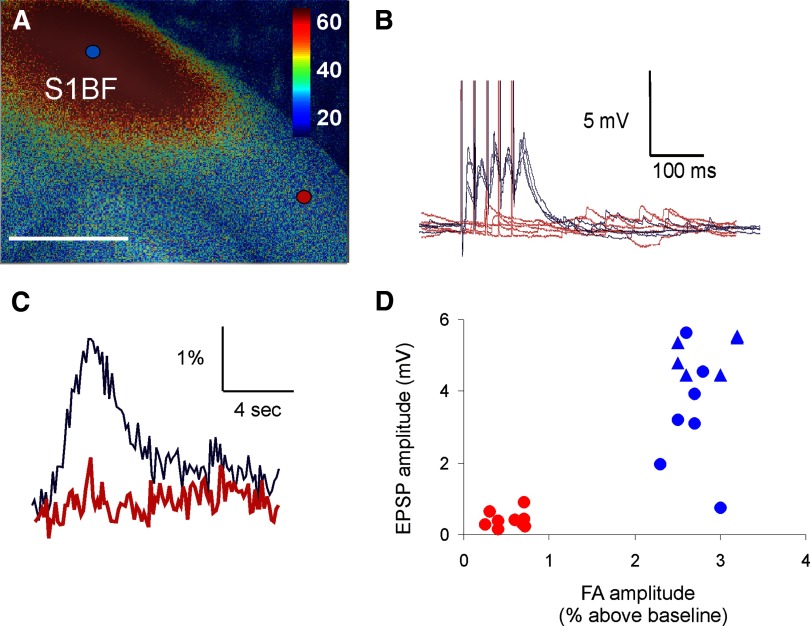
FIG. 4.
Comparison of FA response in S1BF to synaptic responses in neurons recorded via whole cell patch clamp. A: increase in autofluorescence in S1BF after electrical stimulation of VPM (scale bar = 1 mm). B: example voltage traces (5 traces each, overlaid) for a cell in the FA activation zone (blue) and another cell outside the FA activation zone (red). Vertical lines are stimulus artifacts. C: change in fluorescence relative to baseline in 2 × 2-pixel ROI either in the FA activation zone (blue) or outside of the zone (red). D: scatterplot of FA amplitude (expressed as percentage increase from baseline, abscissa) and corresponding excitatory postsynaptic potential (EPSP) amplitude (ordinate). Red symbols represent cells that were not in the FA activation zone. Blue symbols represent cells that were in the FA activation zone. Blue triangles correspond to cells in the FA activation zone that were likely monosynaptically activated based on short EPSP latency. Stimulus parameters: monopolar electrical stimulation using 2-ms-duration pulses, 40 pulses/s for 100-ms train, 14-s intertrain intervals for a total of 2 pulse trains, and 28 s of imaging time.

