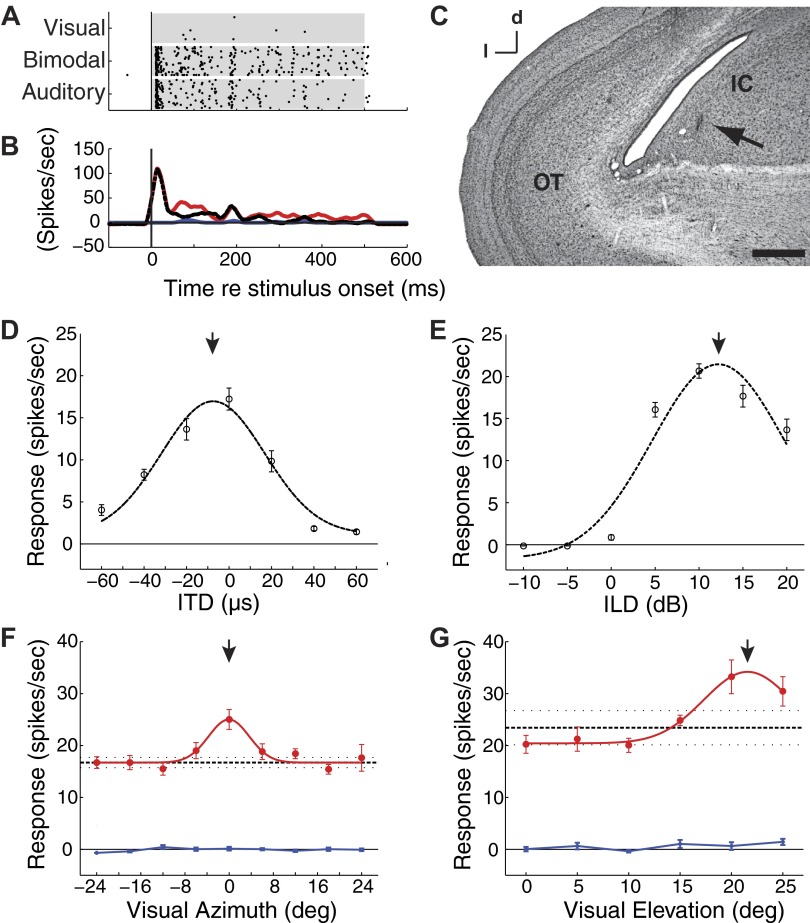
FIG. 1.
Visual enhancement of auditory responses of a single inferior colliculus (ICX) unit. A: raster plots of responses to optimized visual-alone, bimodal, and auditory-alone stimuli. Each point represents the time of a spike to 20 repetitions of each stimulus. Auditory, visual, and bimodal stimuli were presented in a randomly interleaved fashion. Shaded regions indicate the period of stimulus presentation. B: responses, from A, were binned at 1 ms and smoothed with a 15-ms running average (visual, blue; auditory, black-dashed; bimodal, red). C: an electrolytic lesion (arrow) indicates the recording site centered in the ICX (OT, optic tectum; IC, inferior colliculus). Scale bar = 500 μm; d, dorsal; l, lateral. D and E: average responses to interaural time difference (ITD, D) or interaural level difference (ILD, E) during a 500-ms broadband auditory stimulus. Dashed black lines indicate the normal curve that minimized the least squares estimate of the measured data. Error bars represent bootstrap SE. Responses at this site were maximum to an ITD value of -7.5 μs [left ear leading; 95% confidence interval (CI): -10.5 to -4.5; arrow] and an ILD value of 12.2 (right ear greater; 95% CI: 11.5 to 12.9; arrow). F and G: response profiles to visual-alone stimuli (blue), auditory-alone stimuli (black), and bimodal stimuli (red; filled circles) were measured for a range of visual stimulus azimuths (F) and elevations (G). The response to the auditory-alone stimulus is plotted as a horizontal black line (dashed horizontal lines indicate the mean and bootstrap SE) extended across the plot as a reference for bimodal responses. Error bars represent the bootstrap SE. The response enhancements were significant for both azimuth and elevation (F, Paz < 0.0001; G, Pel = 0.035; bootstrap test with Bonferroni correction). Downward arrows: visual modulation field (VMF) center.

