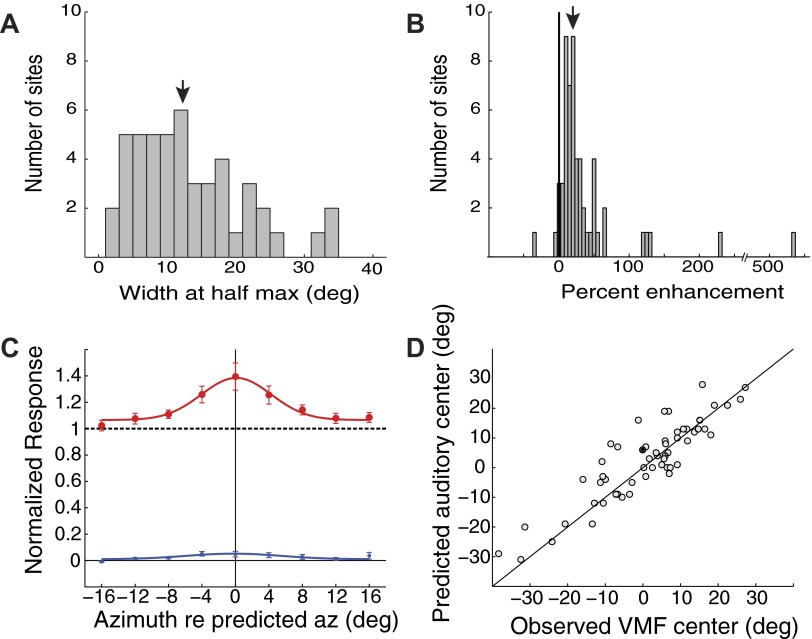
FIG. 2.
Summary of VMF sizes, strengths, and alignments with auditory receptive fields. VMFs were measured by varying the location of a visual stimulus while keeping an optimized auditory stimulus constant. A: VMF widths in azimuth, measured at 50% of the maximum enhancement over auditory-alone responses (downward arrow: median width). B: VMF strengths, measured relative to the maximum auditory-alone responses (downward arrow: median magnitude). C: average VMF (red; filled circles) and visual-alone (blue; asterisks) profiles, calculated by aligning data on the measured VMF center at each site. Response magnitudes were normalized to the auditory-alone response (dashed black). Error bars represent the bootstrap SE. D: the predicted auditory receptive field center, based on tuning to ITD and ILD (see methods), plotted as a function of the observed azimuth of the VMF center (R2 = 0.79; P < 0.00001).

