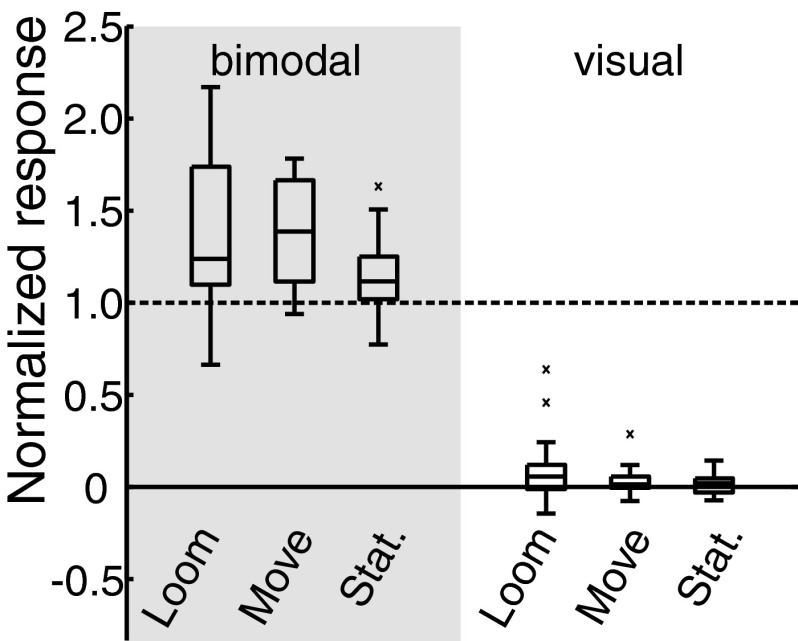
FIG. 6.
Comparison of ICX responses to bimodal and visual-alone stimulation. Three kinds of visual stimuli (looming, moving, and stationary; see methods) were presented with or without a synchronous auditory stimulus. The 1st 50 ms of the stimulus presentation were excluded from analysis because no visual modulation occurred during this time window. Response profiles were normalized to the auditory-alone response (dashed black line) at each site. Each boxplot indicates the smallest value, lower quartile, median, upper quartile, and largest value (outliers are indicated ×). Average bimodal responses were 140.5 ± 10.3% with a looming visual stimulus, 139.7 ± 6.5% with a moving visual stimulus, and 113.9 ± 5.1% with a stationary visual stimuli as compared to the auditory-alone response (Ploom < 0.0001, Pmove < 0.0001, Pstat = 0.0025; bootstrap test with Bonferroni correction). Across all sites, only looming visual-alone stimuli induced a detectable response above baseline (9.2 ± 4.4%) relative to auditory-alone responses (P = 0.006; bootstrap test with Bonferroni correction). Error bars indicate the bootstrap SE.

