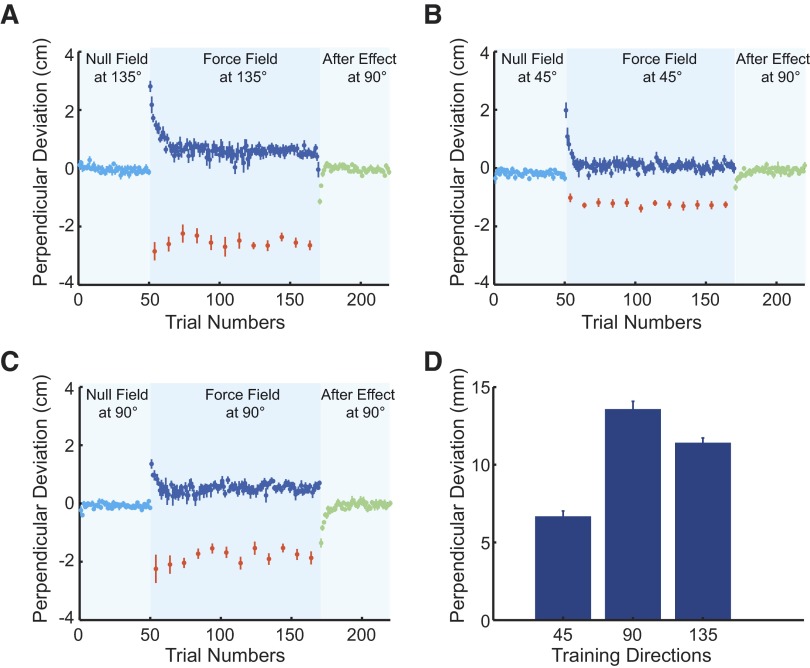
FIG. 3.
Training and transfer movements for targets located at 135, 45, and 90°. Data in A–C are plotted as follows. Data points show mean perpendicular deviation of the hand (±1SE) from a straight line connecting movement start and end, measured at maximum tangential velocity. Following null-field movements (50 trials, light blue points) in a given training direction, subjects made force-field training movements (120 trials, dark blue points) in the same direction. On 10% of training movements, the force field was unexpectedly removed (catch trials, red points). Subjects then made transfer movements in the 90° reference direction (50 trials, green points). A: training movements made in the 135° direction, followed by transfer movements made in the 90° reference direction. B: training movements made in the 45° direction, followed by transfer movements in the 90° direction. C: training and subsequent transfer movements were made in the 90° direction. D: perpendicular deviation on the 1st transfer movement in the 90° reference direction following training in the 3 directions indicated. Subjects trained in the 135° direction, in which the force field acted in the direction of minimum hand stiffness, showed more transfer to the 90° reference direction than subjects who made training movements in the 45° direction.

