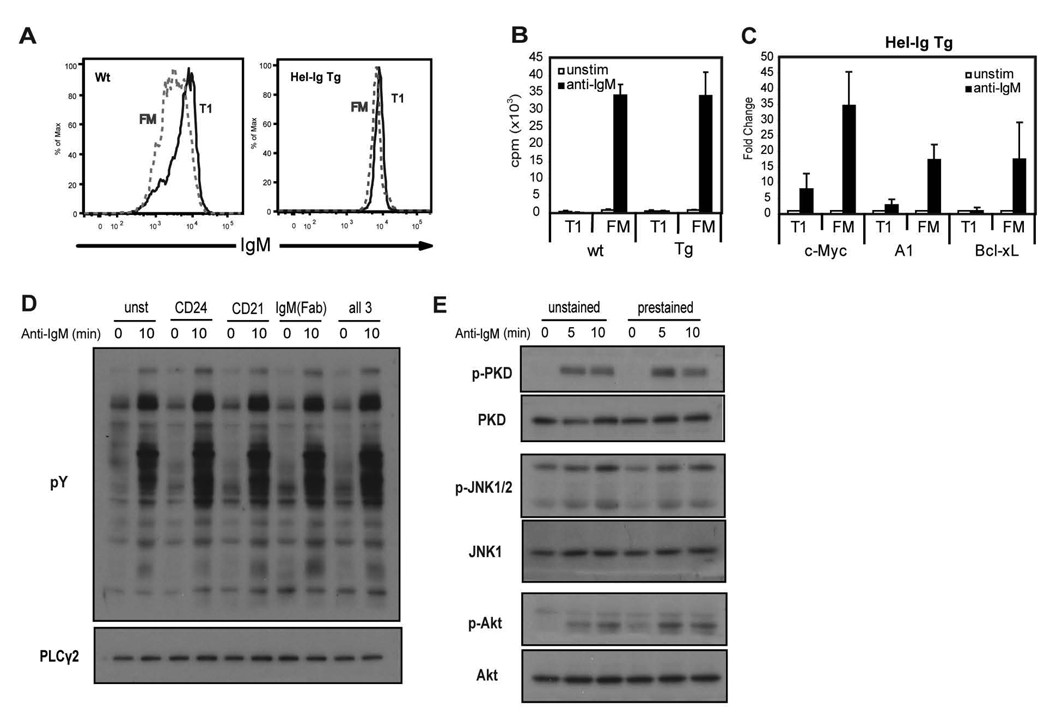
Figure 2.
sIgM expression and anti-IgM responses of T1 and FM B cells from Hel-Ig Tg and WT mice and effect of cell surface antibodies on BCR staining. A, FACS analysis of surface IgM levels of T1 and FM B cells gated based on expression of cell surface markers CD24, CD21 from WT (left panel) and MD4 Hel-Ig Tg (right panel) B cells. B, Proliferative response following anti-IgM stimulation of sorted T1 and FM B cells from WT or Tg mice. C, Fold increase in transcript levels with anti-IgM stimulation (3 h) compared to unstimulated cells from purified WT or Hel-Ig Tg B cells subsets. Mean data with standard deviation (SD) from 5 experiments. D, Total B cells were stained with: anti-CD24, anti-CD21, anti-IgM Fab fragment, all three antibodies, or no antibody and then stimulated with anti-IgM F(ab)2 for 10 min. Whole cell lysates were blotted with anti-pY to measure activation and PLCγ2 to show equal loading. E, Total B cells were stained with anti-CD24, anti-CD21 and anti-IgM Fab fragment (prestained) or with no antibodies (unstained) and stimulated with anti-IgM as in D for the indicated time points. Whole cell lysates were probed with antibodies recognizing: p-JNK1/2, p-PKD and p-AKT. The blot was then stripped and reprobed with anti-JNK1, PKD and AKT antibodies as loading controls.

