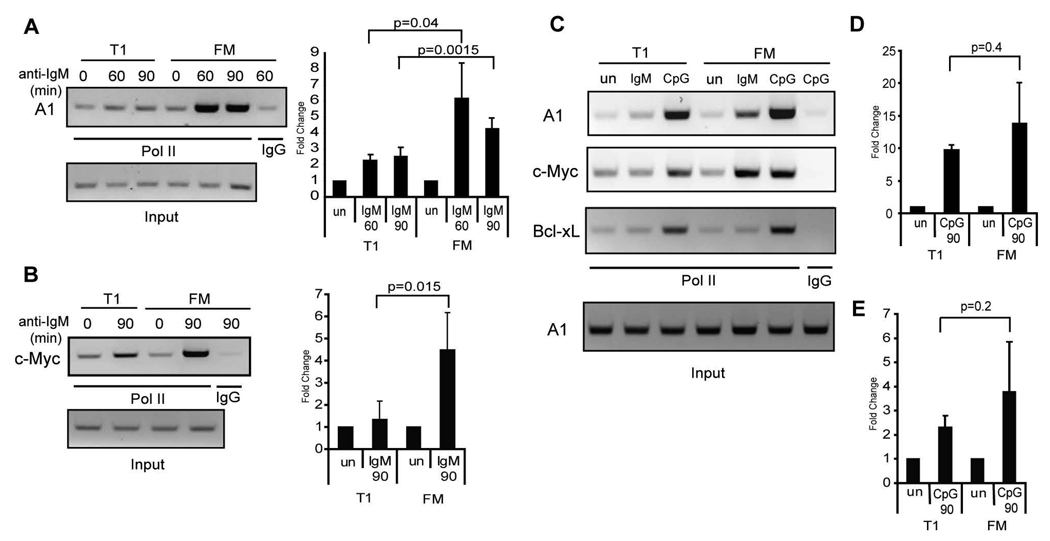
Figure 9.
Deficient transcriptional activation at the A1 and c-Myc promoter in T1 B cells upon BCR crosslinking. A–B, Chromatin from WT T1 and FM B cells stimulated 60 or 90 min with anti-IgM was immunoprecipitated with antibodies that recognize Pol II or polyclonal rabbit IgG as a control. PCR was performed on DNA isolated from immunoprecipitates or 5% of input DNA (loading control) to amplify a DNA region within the A, A1 promoter, or B, c-Myc promoter. Shown is a representative figure of 3 independent experiments (left panel) and mean with SD of the fold increase in PCR product over unstimulated cells (right panel). C–E, Chromatin from WT T1 and FM B cells stimulated 90 min with anti-IgM or CpG was immunoprecipitated as above and PCR was performed as indicated. C, Representative figure of 4 independent experiments. D–E, Mean with SD of the fold increase in PCR product over unstimulated cells obtained using primers recognizing the D, A1 promoter, or E, c-Myc promoter.

