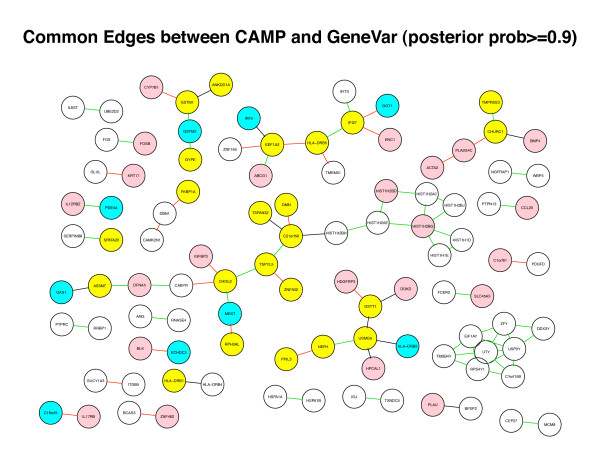
Figure 3.
Sub-network of 86 edges appeared in both CAMP and GeneVar network using a subset of 608 genes and threshold of posterior probability of 0.9. Color nodes denote hubs (pink = CAMP, cyan = GeneVar, yellow = both). The color of the edges denote the direction (Green = both positive, Black = both negative, Red = opposite).

