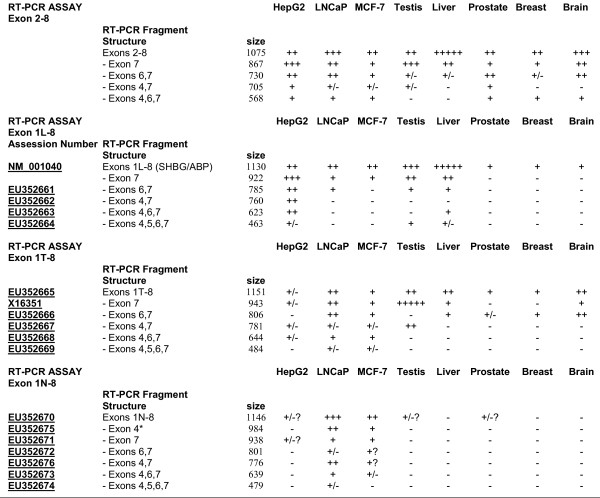
Figure 3.
Summary of RT-PCR results. Semiquantitative representation of the relative amounts of each RT-PCR fragment. For ease of comparison, the abundance of each RT-PCR fragment in the exon 2–8 and the exon 1–8 RT-PCR assays has been assigned a value, denoted by the following- "+++++" most abundant, down to "+" detectable, "+/-" barely detectable, and "-" not detectable. For each individual assay, transcript structures were determined by sequence analysis of designated RT-PCR fragments (see Results). These were used to assign structures to similar sized RT-PCR fragments from remaining samples. *: This band was a mixture of 1N-8-exon 4 sequences and those of an ambiguous sequence. "?"-inconsistent appearance of fragment, presumably due to low abundance.

