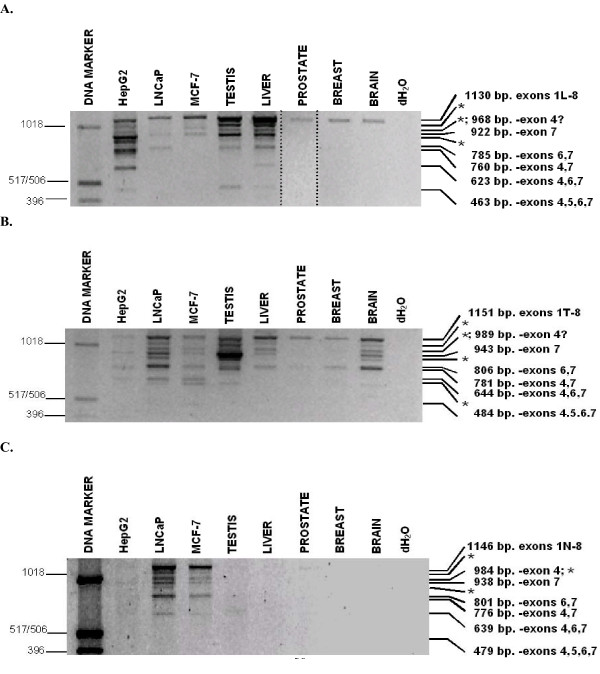
Figure 6.
RT-PCR analysis of transcripts including exon 1L (top), exon 1T (middle), and exon 1N (bottom). Separate individual RT-PCR amplifications were performed using 5' primers specific for exon 1L, 1T, and 1N, and a common exon 8 3' primer. Products were electrophoresed through a 1% agarose gel. All fragments were reamplified and sequenced. Bands labeled "*" produced ambiguous sequences that were inconsistent with the sizes of the transcripts, and which were identical to other characterized sequences (the smallest "*" fragment in the 1T-8 assay gave an unrelated sequence). DNA marker sizes, in base pairs, are given on the left. RT-PCR fragment transcript structures and sizes are given on the right. Note- 5A is a merged figure from two experiments to more clearly show the prostate 1L-8 RT-PCR fragment. Certain HepG2, MCF-7, testis and prostate fragments showed varied appearance in the 1N-8 assay, presumably due to their low relative abundance (Figure 3).

