Figure 8.

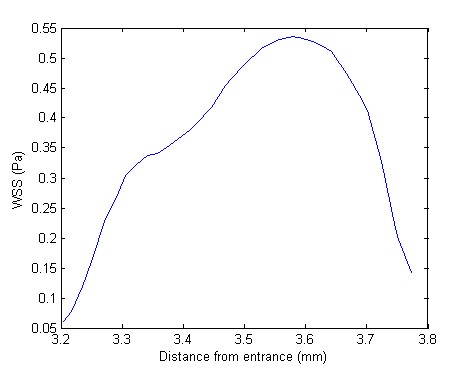
Partial wall shear stress plot. Close-up of WSS distribution corresponding to the region between the first and second struts of Figure 7.

Partial wall shear stress plot. Close-up of WSS distribution corresponding to the region between the first and second struts of Figure 7.