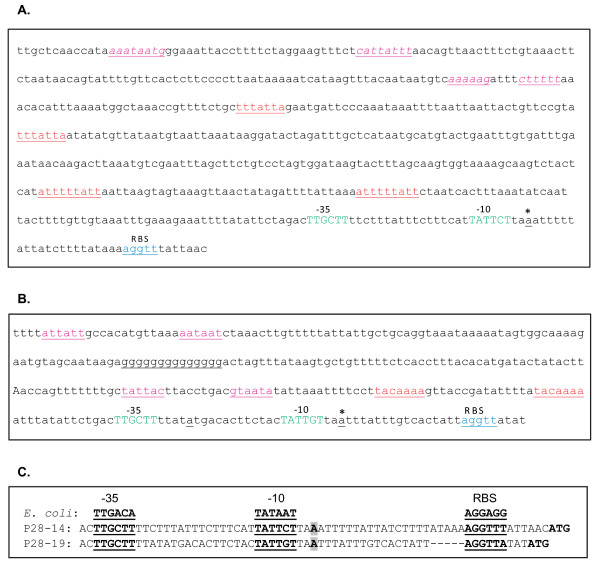
Figure 3.
P28-Omp genes 14 and 19 promoter region sequence analysis. Upstream sequences of genes 14 (panel A) and 19 (panel B) were evaluated for the presence of direct repeats (red text), palindromic sequences (pink text) and for the presence of unique sequences (G-rich region), consensus -35 and -10 regions (green text) and ribosome binding sites (blue text). Panel C shows the comparison of -10, -35 and ribosome binding sites of genes 14 and 19 with the E. coli consensus sequences. Transcription start sites for the genes mapped by primer extension analysis are identified with bold and grey color highlighted text or with an asterisk. Dashes were introduced in the p28-Omp gene 19 sequence to create alignment with the gene 14 sequence.

