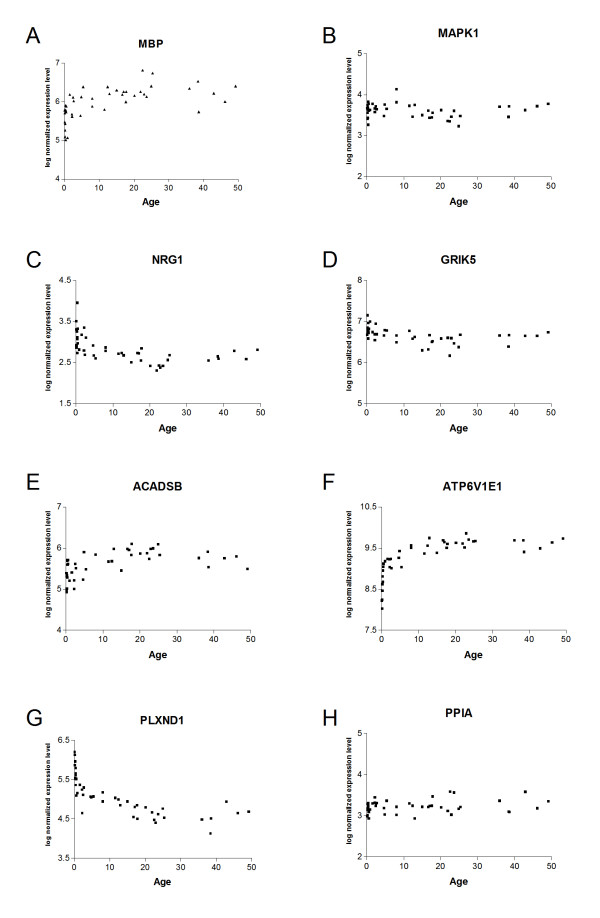
Figure 2.
Expression plots. Expression levels (log normalized; arbitrary units) versus age (years) were plotted for selected genes of interest which were significantly correlated with a template showing a peak of expression in the age range 15–25: (a) myelin component myelin binding protein (MBP) (r = 0.51, q = 0.020) (b) signaling molecule MAP kinase-1 (MAPK1) (r = -0.55, q = 0.010); (c) glucose metabolism gene acyl coA dehydrogenase (ACADSB) (r = 0.59, q = 0.008) and (d) the electron transport chain component ATP6V1E1 (r = 0.54, q = 0.014); (e) schizophrenia candidate risk factor gene neuregulin-1 (NRG1) (r = -0.59, q = 0.008); (f) ionotropic glutamate receptor subunit GRIK5 (r = -0.60, q = 0.007); (g) axon guidance molecule plexin-D1 (r = -0.56, q = 0.011). For comparison, the housekeeping gene (h) PPIA is also shown (r = 0.14, q = 0.758).

