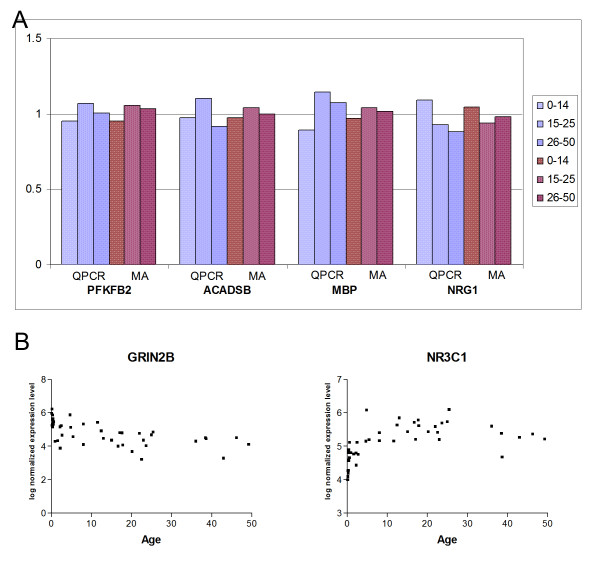
Figure 4.
Validation. (a) Quantitative real-time PCR (QPCR) validation of microarray (MA) data for 4 genes, PFKFB2, NRG1, ACADSB and MBP. Expression values shown are fold change in each of 3 age groups relative to the mean for the whole dataset. (b) Plots showing log normalized expression levels (arbitrary units) versus age (years) of two genes, NMDA receptor subunit 2B (GRIN2B) and the glucocorticoid receptor NR3C1, which show the expected expression pattern based on previous studies of the developing primate prefrontal cortex.

