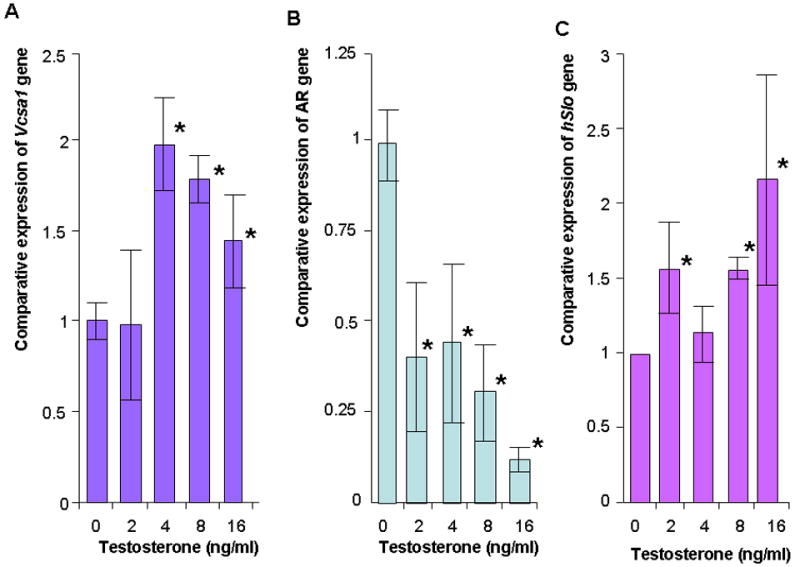
Figure 3.

A, B and C: The expression of Vcsa1, AR and Slo in corporal smooth muscle cells in vitro with increasing concentrations of testosterone. Expression of gene transcripts normalized to RPL24 was analyzed using the comparative crossing threshold (Ct) method. The untreated cells were used as calibrator (set as 1). Each quantitative RT-PCR measurement was performed more than four times for each concentration of testosterone. The bars represent the mean comparative expression of the gene, and the error bars the standard deviation. *=Significantly different expression of Vcsa1, AR or Slo compared to cells in the absence of testosterone (P < 0.05).
