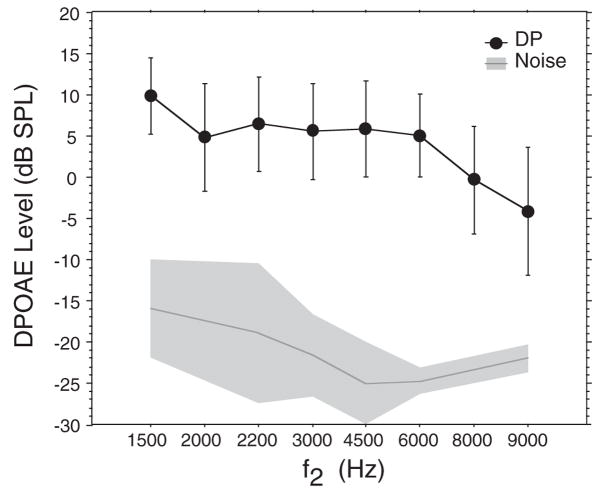
Fig. 1.
Mean DP-gram (DPOAE level × f2 frequency) for 48 adult subjects. The frequency axis in Figure 1 (and in figures throughout the manuscript) represents discrete values of f2 rather than a continuum of frequency. The spacing between these values is shown as equal although the actual frequency interval between them varies. Mean noise levels are indicated by the dark gray line. Error bars and shaded area of noise floor = ±1 SD of the mean.

