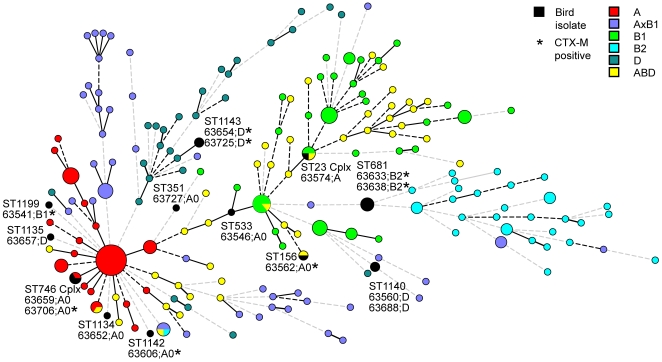
Figure 2. Distribution of 16 ESBL producing E. coli isolates within a minimum spanning tree representing 273 previously reported STs (dots) from a collection of 459 diverse E. coli isolates.
The tree is based on the degree of allele sharing by MLST analysis. Clonal complexes composed of at least three ST members are indicated by dots proportional in size to the number of STs within them. STs, isolate designations, phylogenetic group, and distribution of CTX-M genes of ESBL producing E. coli from birds are indicated (black dots). Uniformly colored dots indicate a shared phylogenetic group. Thick lines connecting pairs of STs indicate that they share six (thick lines) or five (thin lines) alleles. Dotted connecting lines represent less allele sharing.

