Figure 2.
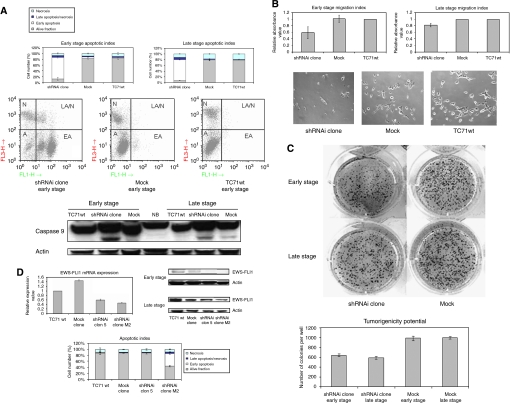
The long-term reduction in EWS–FLI1 provoked an increase in the apoptotic fraction, reduced migration capacity, and oncogenic transformation. There is a direct relationship between the extent of the interference of the fusion transcript and the degree of change observed. (A) Induction of apoptosis by reduction in the expression of EWS–FLI1 using specific shRNAi in the TC71 Ewing sarcoma cell line in an early and late stage. The shRNAi clone corresponds to the TC71 shRNAi clone 6. The cells were seeded on 24 well plates, 24 h after apoptotic index was determined by FACS using an annexin V detection kit assay. The means±standard deviations (error bars) of four independent experiments are shown. FACS Apoptotic Analysis Figures show the various cell populations. A, alive fraction; EA, early apoptosis; LA/N, late apoptosis/necrosis; N, necrosis. x asis: FL3-H Annexin V; y axis: FL1-H PI. Panel below shows the activation of Caspase 9 in the shRNAi clone in both stages by western Blot. (B) The shRNAi clone cells were less able to migrate through the matrix of Transwell in both stages, early and late. The shRNAi clone corresponds to the TC71 shRNAi clone 6. A total of 100 000 alive cells were counted using a Neubauer chamber and seeded over the transwell in 24 well-format plates. After 16 h, cells of the upper part of the transwell were scrapped, cells migrated to the bottom part of the transwell were fixed, stained with blue violet solution and discoloured with acetic acid. Absorbance was measured at 570 nm. Photographs of migrated cells taken with a Nikkon 10 × objective. Columns, mean of replicates of three different experiments; bars, s.d. (C) The diminished expression of EWS–FLI impairs the number and size of colonies in the shRNAi clone. The shRNAi clone corresponds to the TC71 shRNAi clone 6. Colonies were photographed after 2 weeks. Experiments were performed three times with several replicates. (D) The EWS–FLI1 shRNAi extension determined the degree of the changes that were not because of unspecific clonal ‘off-target’ effects. Analysis by western blotting showed that the EWS–FLI1 expression was reduced in the early stage in both shRNAi clones, 5 and M2, although only shRNAi clone M2 maintained partially EWS–FLI1 reduction in the late stage. Actin is shown as a loading control. The increase in the apoptotic index was directly correlated to the degree of EWS–FLI1 interference. The shRNAi clone number 5 showed no change in the apoptotic index compared with shRNAi clone M2 that had a more pronounced inhibition of EWS–FLI1 and showed a increase in its apoptotic fraction. The cells were seeded on 24 well plates, 24 h after apoptotic index was determined by FACS using an Annexin V detection kit assay. The means±standard deviations (error bars) of four independent experiments are shown. Columns, mean of triplicates of three separate replicates; bars, s.d.

