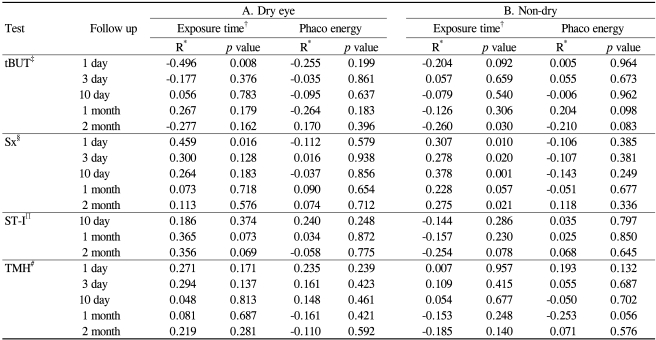
Table 4.
Correlation between dry eye test values and microscopic light exposure time and between dry eye test values and phacoemulsification energy in the dry eye group (A) and the non-dry eye group (B)
*R=Spearmann Correlation Coefficient; †Exposure Time=Exposure Time to microscopic light; ‡tBUT=tear break-up time; §Sx=dry eye symptom; ∥ST-I=Schirmer test I; #TMH=tear meniscus height.

