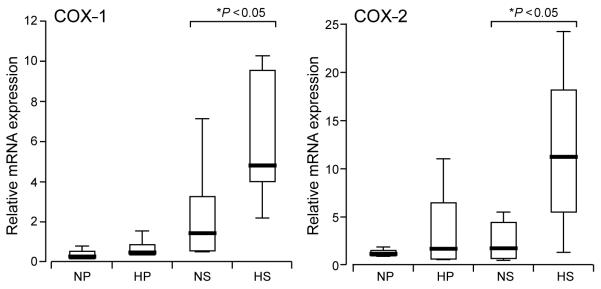
Figure 1.
Box plot demonstrating relative cyclooxygenase-1 (COX-1) and COX-2 mRNA expression in proliferative and secretory endometrium of women with normal and heavy measured menstrual blood losses (MBLs) (normal MBL ≤80 ml and heavy MBL >80 ml). The data are presented as box-and-whisker plots: box represents the 25th and 75th percentiles and the heavy bar represents the median. The whiskers are the 10th and 90th percentiles. NP, normal proliferative (n = 7); HP, heavy proliferative (n = 5); NS, normal secretory (n = 6); HS, heavy secretory (n = 5) Asterisk indicates significant difference (P < 0.05).

