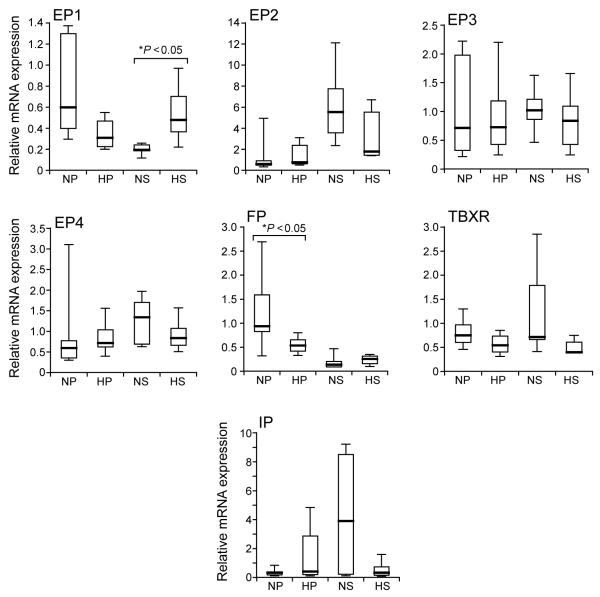
Figure 2.
Composite figure of box plot graphs demonstrating relative mRNA expression for prostanoid receptors in proliferative and secretory endometrium of women with normal and heavy measured menstrual blood losses (MBLs) (normal MBL ≤80 ml and heavy MBL >80 ml). The data are presented as box-and-whisker plots: box represents the 25th and 75th percentiles and the heavy bar represents the median. The whiskers are the 10th and 90th percentiles. NP, normal proliferative (n = 7); HP, heavy proliferative (n = 5); NS, normal secretory (n = 6); HS, heavy secretory (n = 5). EP1 to EP4 are the receptors for prostaglandin E2; FP is the receptor for prostaglandin F2α; TBXR is the receptor for thromboxane and IP is the receptor for prostacyclin. Asterisk indicates significant difference (P < 0.05).

