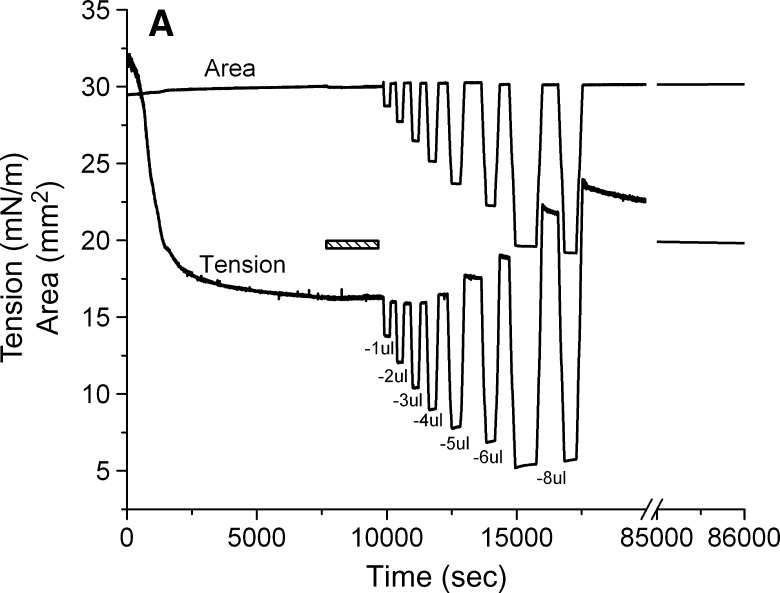
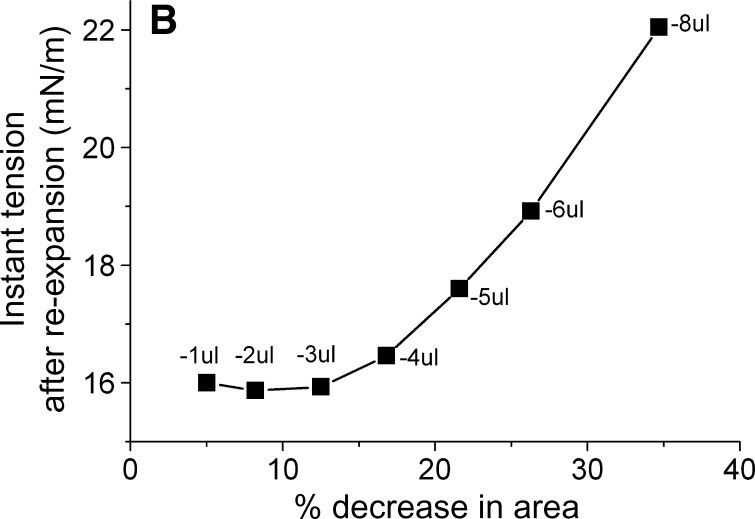
Fig. 5.
Slow compression and expansion procedure after buffer exchange. A: The tension and area versus time curves for the slower compression and expansion following the adsorption and the buffer exchange. A 16 μl triolein drop was formed in pH 4.85 2 mM phosphate buffer. The concentration of apoB[37–41] in the aqueous phase was 1.3 × 10⁻⁷ M before buffer exchange. 150 ml phosphate buffer was exchanged (shown as the bar in the figure). Then the drop was compressed by decreasing the drop volume by −1, −2, −3, −4, −5, −6, and −8 μl at a rate of 0.02 μl/s to different level. After the compressed volume was held for several minutes, the drop was re-expanded by increasing the drop volume to the original 16 μl at the same rate respectively. Then the tension was followed over 20 h period (shown as the break in the figure) while the tension dropped slowly from 23 mN/m to 19.7 mN/m. B: The plot of the instant tension produced after the slow re-expansion versus the percentage decrease in area of each corresponding slow compression derived from curves in the left panel.


