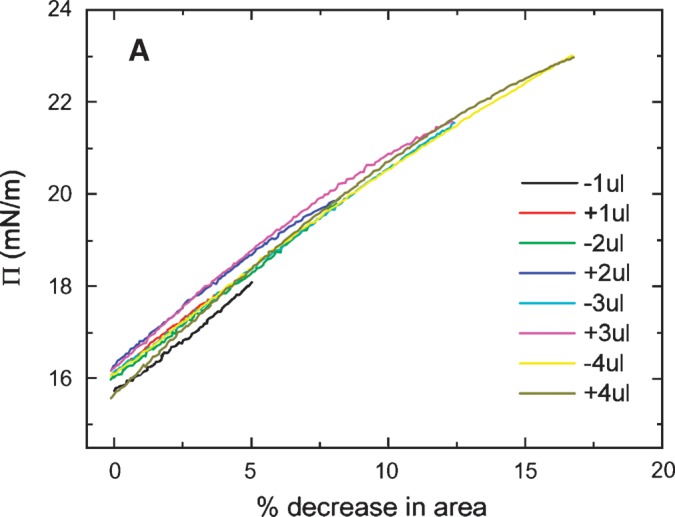
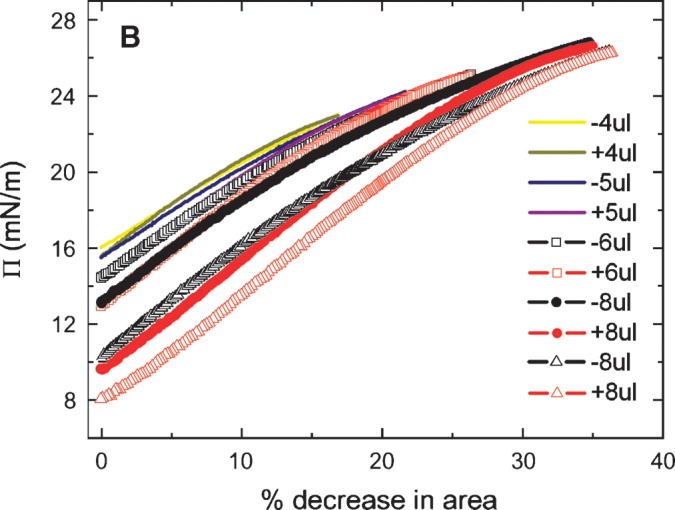
Fig. 6.


Π versus the % change in area plots of slow compression and expansion derived from the measurement in Fig. 5 (left). A: Plots derived from 1, 2, 3 and 4 μl compression and expansions. Little hysteresis was shown in the plots indicating an elastic behavior. B: Plots derived from 4, 5, 6, and 8 μl compression and expansion. Plots of compression and expansion greater than 4 μl showed hysteresis indicating loss of protein at the interface.
