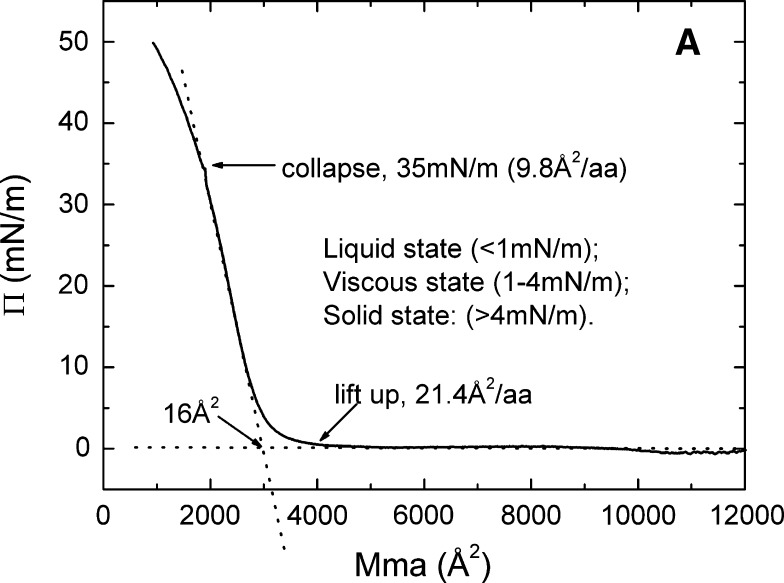
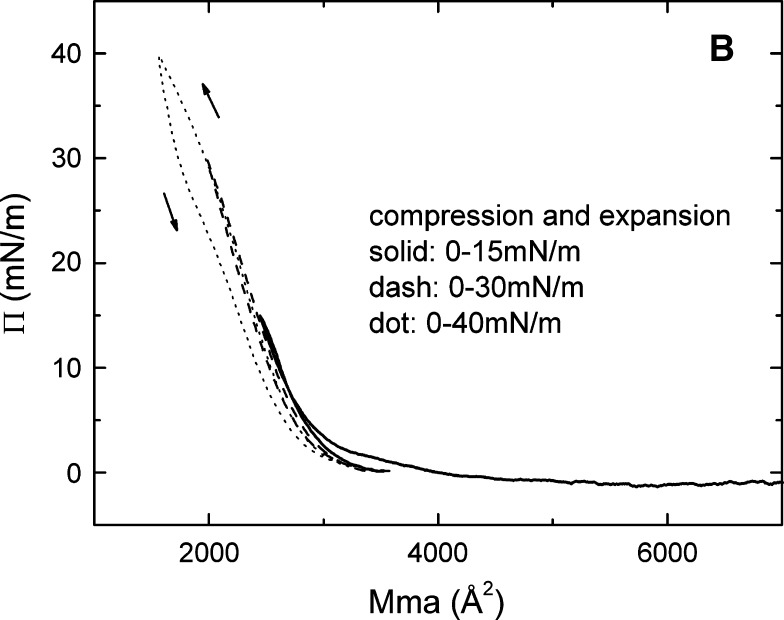
Fig. 8.
The pressure/area (Π-A) isotherm (A) and the up and down experiments (B) of apoB[37–41] at the A/W interface. ApoB[37–41] peptide (9 μg) in 30% (wt/vol) isopropanol/phosphate buffer at pH 3.0 was spread on a 3.5 M KCl 10 mM pH 7.4 phosphate subphase at 25°C. A: The monolayer was compressed at 5 mN/m per min to produce the Π-A isotherm. Lift-off occurs at 4000 Å2/molecule (21.4 Å2/amino acid) and collapses at 35 mN/m (9.8 Å2/amino acid). The physical state of the surface as a function of Π is indicated. B: The monolayer was compressed and expanded at 5 mN/m per min, first from 0 to 15 mN/m (solid curve), then from 0 to 30 mN/m (dash curve), and finally from 0 to 40 mN/m (dot curve), respectively. The curve compressed to 40 mN/m (above the collapse Π of 35 mN/m), showing that the expansion curve has a smaller area than the compression curve indicating nonreversibility.


