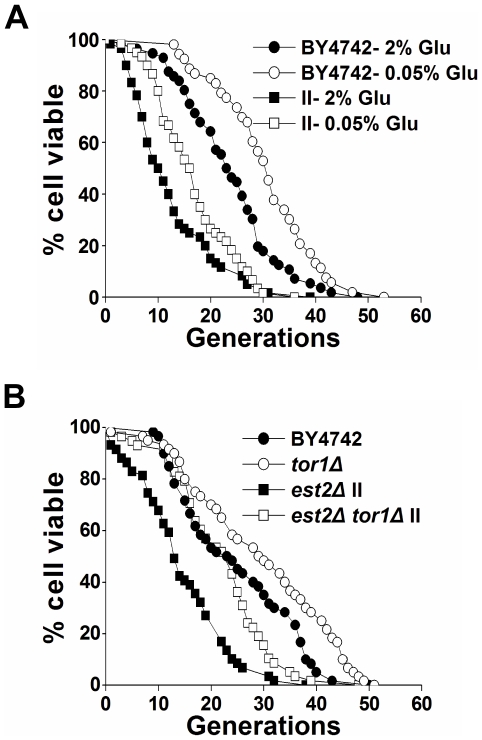
Figure 3. Calorie restriction or inactivation of the TOR pathway extends the life span of type II survivors.
(A) Calorie restriction in est2Δ type II survivors. Mean life span of strains shown: BY4742-2% Glucose, 23.6±9.3 (n = 56); BY4742-0.05% Glucose, 30.5±9.2 (n = 53); est2Δ type II-2% Glucose, 12.6±8.0 (n = 60); est2Δ type II-0.05% Glucose, 16.7±7.2 (n = 60). (B) Life span analysis in est2Δ type II survivors with TOR1 deletion. Mean life span of strains shown: BY4742, 24.8±11.1 (n = 60); tor1Δ, 29.4±12.9 (n = 60); est2Δ type II, 14.6±8.6 (n = 59); tor1Δ est2Δ type II, 22.0±9.1 (n = 58).

