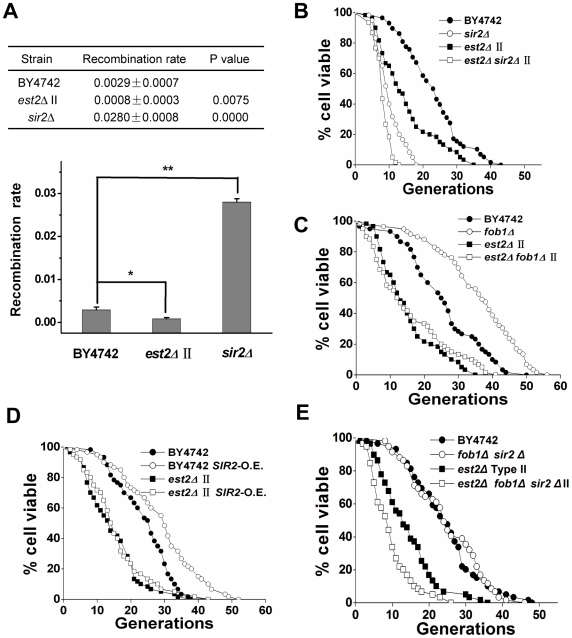
Figure 7. rDNA recombination is reduced in telomerase-null type II survivor cells.
(A) rDNA recombination assay. The upper panel shows the average recombination rate of three independent isolates with indicated standard deviations. Approximately 20,000–30,000 colonies were examined for each strain. P values were obtained using student's t test. The lower panel contains a graph of the average recombination rates and standard deviations from the upper panel. (B) Life span analysis of est2Δ type II survivors with SIR2 deletion. Mean life span of strains shown: BY4742, 23.1±8.6 (n = 58); sir2Δ, 10.3±3.7 (n = 60); est2Δ type II, 14.6±8.6 (n = 59); sir2Δ est2Δ type II, 8.55±4.42 (n = 53). (C) Life span analysis of est2Δ type II survivors with FOB1 deletion. Mean life span of strains shown: BY4742, 25.5±10.9 (n = 60); fob1Δ, 35.7±12.0 (n = 59); est2Δ type II, 14.6±8.5 (n = 59); fob1Δ est2Δ type II, 13.4±10.7 (n = 59). (D) Life span analysis of est2Δ type II survivors with SIR2 over-expression. Mean life span of strains shown: BY4742, 23.8±7.6 (n = 60); BY4742 SIR2-O.E., 29.0±11.2 (n = 60); est2Δ type II, 14.7±8.0 (n = 60); est2Δ type II SIR2-O.E., 15.9±8.9 (n = 60). (E) Life span analysis of est2Δ type II survivors with FOB1 SIR2 double deletion. Mean life span of strains shown: BY4742, 24.3±9.7 (n = 59); fob1Δ sir2Δ, 24.8±9.6 (n = 59); est2Δ type II, 14.2±7.6 (n = 59); fob1Δ sir2Δ est2Δ type II, 9.6±5.6 (n = 59).

