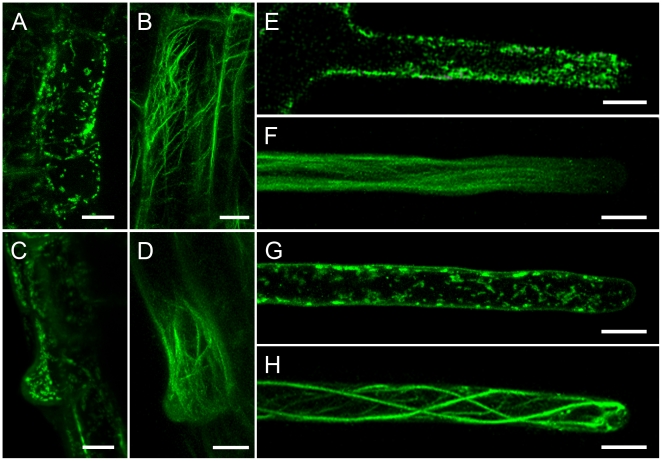
Figure 1. Mitochondrial distribution and actin organization in root hairs at different developmental stages.
Mitochondria are labeled with MitoTracker, actin is visualized using GFP-FABD2. The single pictures represent a stack of all optical sections through these cells visualized by spinning disc confocal microscopy. A. Mitochondria were evenly distributed in the cortical cytoplasm in pre-bulge of trichoblast. Scale bar = 10 µm. B. Thick actin filaments formed a network in prebulge trichoblast. Scale bar = 10 µm. C. Mitochondrial distribution in a bulge. Note that mitochondria were agreggated within the region where the bulge formed. Scale bar = 10 µm. D. Actin filaments are undetected in the tip of bulge, whereas fine actin filaments are visible in the site of bulge outgrowth. Scale bar = 10 µm. E. Mitochondrial distribution in a fast elongating root hair. Note the large number of mitochondria in the subapical region. Scale bar = 10 µm. F. Actin filaments in fast elongating root hairs. Note the large number of fine actin filaments in the subacpcial region and absence of actin filaments in the apical region. Scale bar = 10 µm. G. In the full growth root hair, mitochondrial density significantly decreased and showed uniform distribution. Scale bar = 10 µm. H. Thick actin filaments arranged in the full growth root hair. Scale bar = 10 µm

