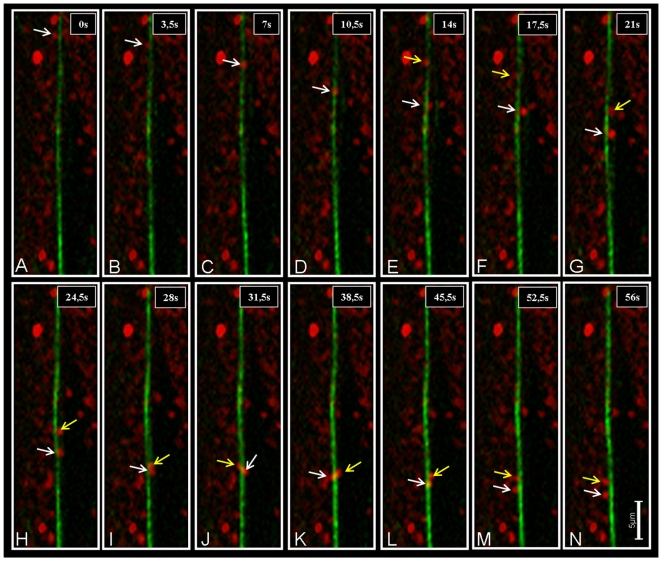
Figure 6. Movement of two mitochondria along an actin filament cable.
In images A–G a mitochondrion (white arrow) is turning around the axis of the filament while moving downwards. When the second mitochondrion (yellow arrow) appears, it contacts the first (picture I). In contrast to the first turn of the single mitochondrion, there is no downward movement of the touching mitochondria while they are turning around the axis of the actin bundle. Mitochondria are labeled with MitoTracker (red), actin is visualized using GFP-FABD2 (green). The single pictures represent a single frame of a “flat merged” projection (each comprised of 14 images in z-axis) of a 4–D time series. The 5 µm scale bar in N applies for all images in this figure.

